| __timestamp | Atlassian Corporation | Garmin Ltd. |
|---|---|---|
| Wednesday, January 1, 2014 | 37986000 | 1266246000 |
| Thursday, January 1, 2015 | 52932000 | 1281566000 |
| Friday, January 1, 2016 | 75783000 | 1339095000 |
| Sunday, January 1, 2017 | 119161000 | 1303840000 |
| Monday, January 1, 2018 | 172690000 | 1367725000 |
| Tuesday, January 1, 2019 | 210285000 | 1523529000 |
| Wednesday, January 1, 2020 | 268807000 | 1705237000 |
| Friday, January 1, 2021 | 336021000 | 2092336000 |
| Saturday, January 1, 2022 | 465707000 | 2053511000 |
| Sunday, January 1, 2023 | 633765000 | 2223297000 |
| Monday, January 1, 2024 | 803495000 | 2600348000 |
Unlocking the unknown
In the ever-evolving tech landscape, understanding cost efficiency is crucial. Atlassian Corporation and Garmin Ltd., two giants in their respective fields, offer a fascinating study in contrasts. From 2014 to 2023, Atlassian's cost of revenue surged by over 2,000%, reflecting its rapid growth and expansion. In contrast, Garmin's cost of revenue increased by a more modest 75%, showcasing its steady, mature market presence.
This data reveals not just numbers, but the strategic paths these companies have taken over the past decade, offering valuable insights for investors and industry watchers alike.
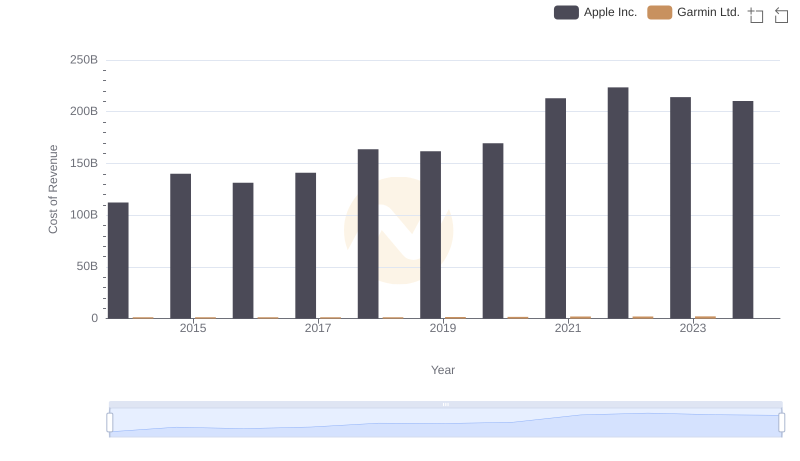
Cost of Revenue: Key Insights for Apple Inc. and Garmin Ltd.
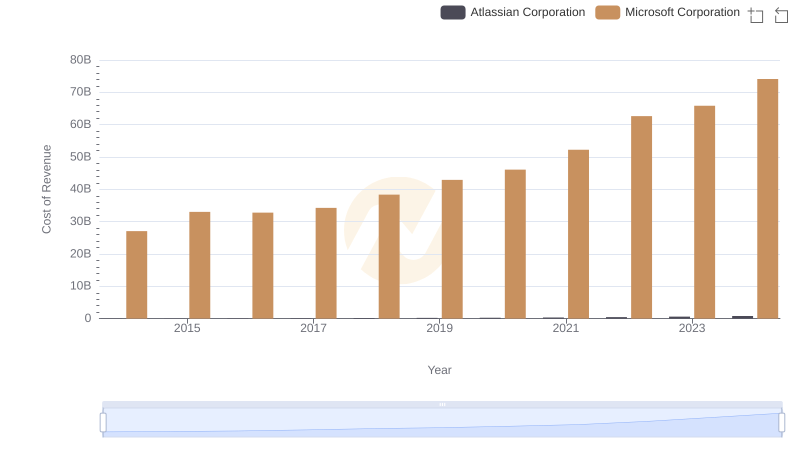
Cost of Revenue Trends: Microsoft Corporation vs Atlassian Corporation
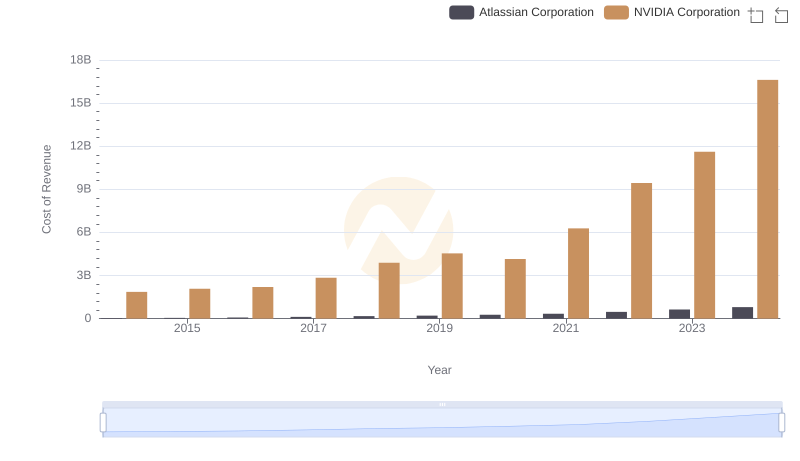
Cost of Revenue Trends: NVIDIA Corporation vs Atlassian Corporation
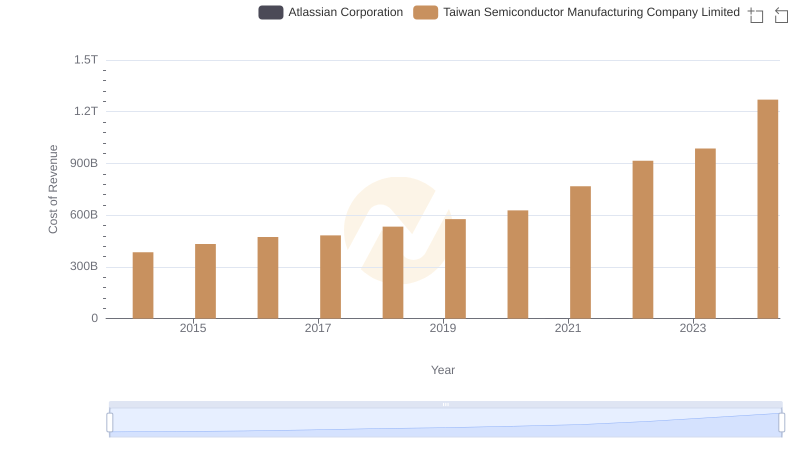
Comparing Cost of Revenue Efficiency: Taiwan Semiconductor Manufacturing Company Limited vs Atlassian Corporation
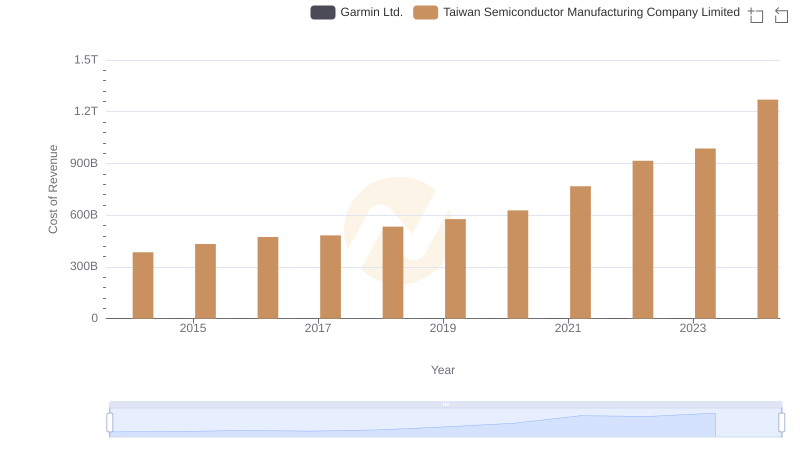
Cost of Revenue Trends: Taiwan Semiconductor Manufacturing Company Limited vs Garmin Ltd.
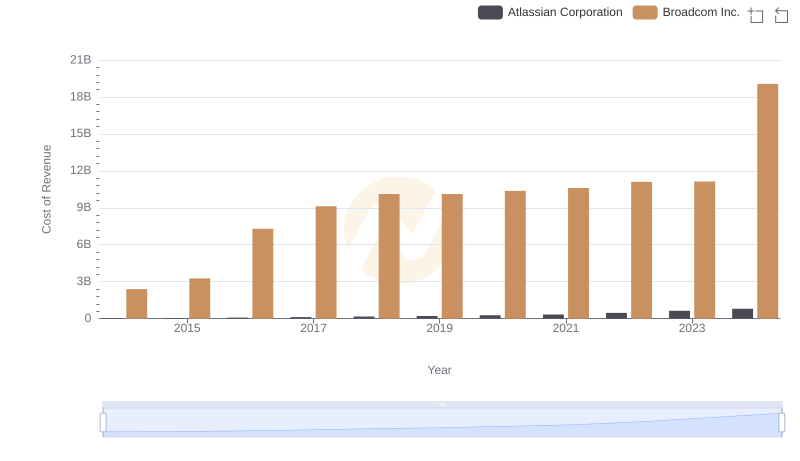
Cost Insights: Breaking Down Broadcom Inc. and Atlassian Corporation's Expenses
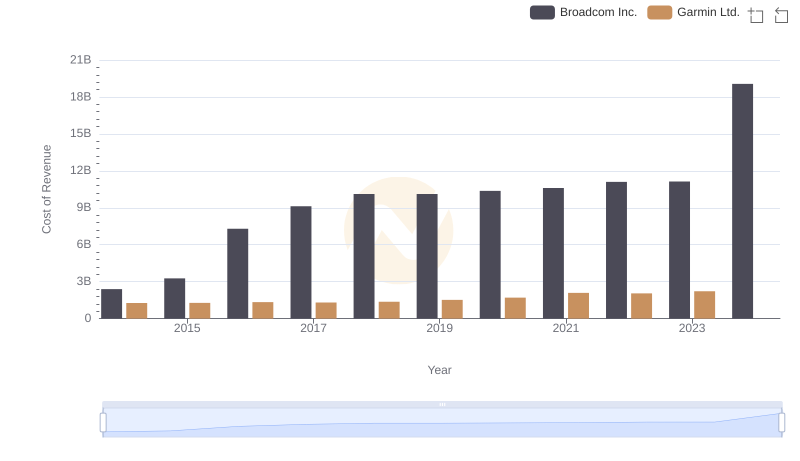
Broadcom Inc. vs Garmin Ltd.: Efficiency in Cost of Revenue Explored
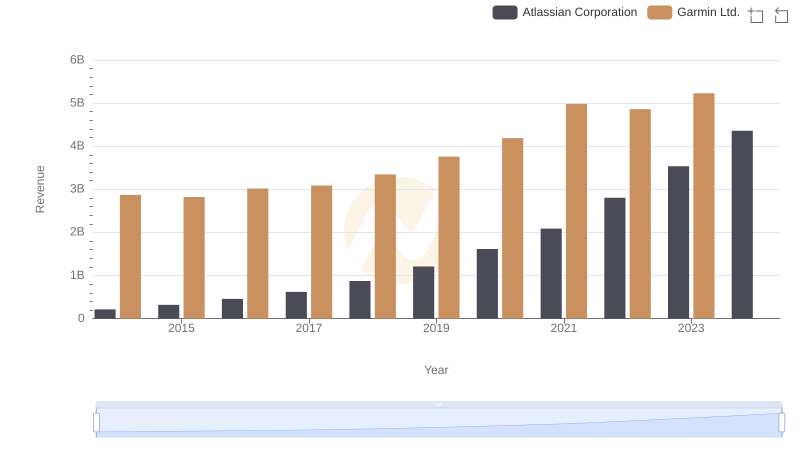
Annual Revenue Comparison: Atlassian Corporation vs Garmin Ltd.
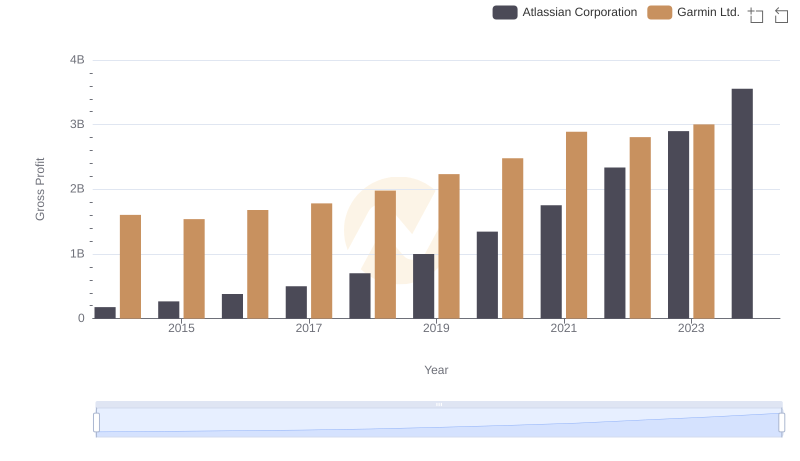
Who Generates Higher Gross Profit? Atlassian Corporation or Garmin Ltd.
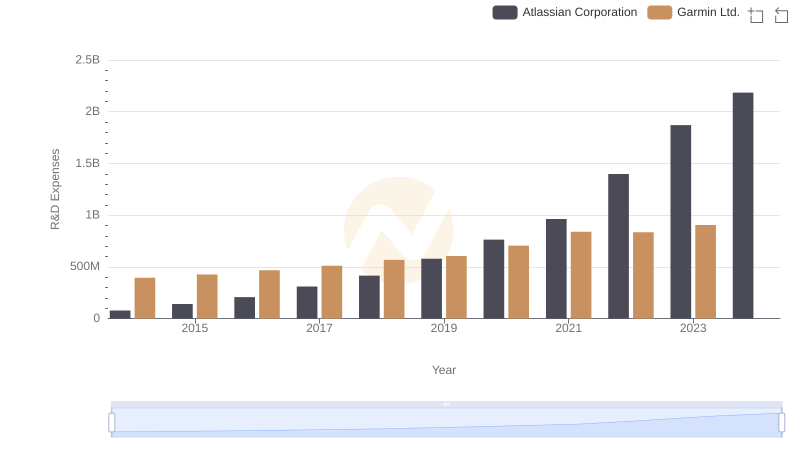
R&D Spending Showdown: Atlassian Corporation vs Garmin Ltd.
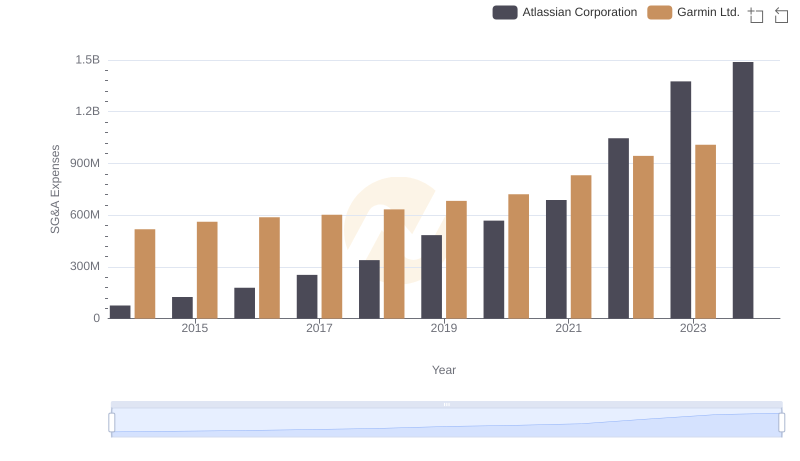
Cost Management Insights: SG&A Expenses for Atlassian Corporation and Garmin Ltd.