| __timestamp | KLA Corporation | Oracle Corporation |
|---|---|---|
| Wednesday, January 1, 2014 | 2929408000 | 38275000000 |
| Thursday, January 1, 2015 | 2814049000 | 38226000000 |
| Friday, January 1, 2016 | 2984493000 | 37047000000 |
| Sunday, January 1, 2017 | 3480014000 | 37728000000 |
| Monday, January 1, 2018 | 4036701000 | 39831000000 |
| Tuesday, January 1, 2019 | 4568904000 | 39506000000 |
| Wednesday, January 1, 2020 | 5806424000 | 39068000000 |
| Friday, January 1, 2021 | 6918734000 | 40479000000 |
| Saturday, January 1, 2022 | 9211883000 | 42440000000 |
| Sunday, January 1, 2023 | 10496056000 | 49954000000 |
| Monday, January 1, 2024 | 9812247000 | 52961000000 |
Infusing magic into the data realm
In the ever-evolving tech industry, Oracle Corporation and KLA Corporation have showcased remarkable revenue trajectories over the past decade. From 2014 to 2024, Oracle's revenue has consistently outpaced KLA's, with Oracle's 2024 revenue reaching approximately 53 billion USD, a 40% increase from 2014. Meanwhile, KLA has demonstrated impressive growth, with its revenue more than tripling from 2.9 billion USD in 2014 to nearly 10 billion USD in 2024.
This comparison highlights the dynamic nature of the tech industry, where strategic innovation and market adaptation drive financial success.
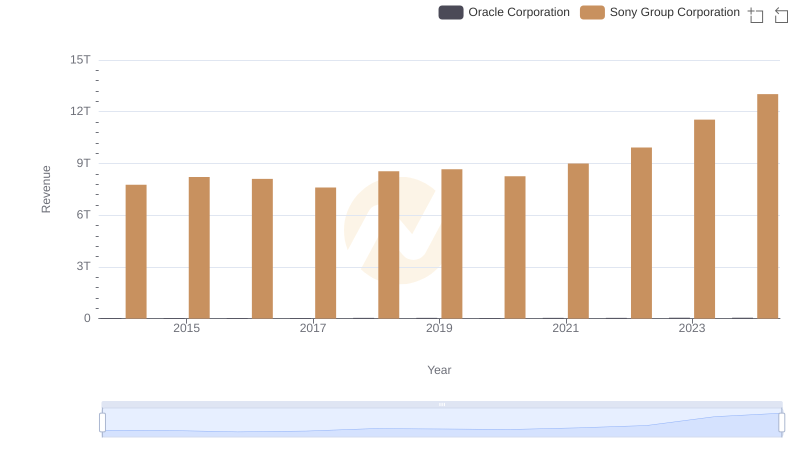
Breaking Down Revenue Trends: Oracle Corporation vs Sony Group Corporation
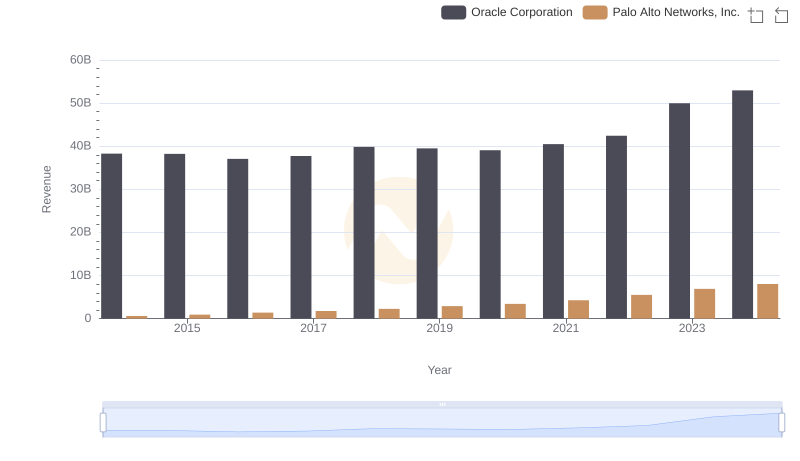
Oracle Corporation vs Palo Alto Networks, Inc.: Examining Key Revenue Metrics
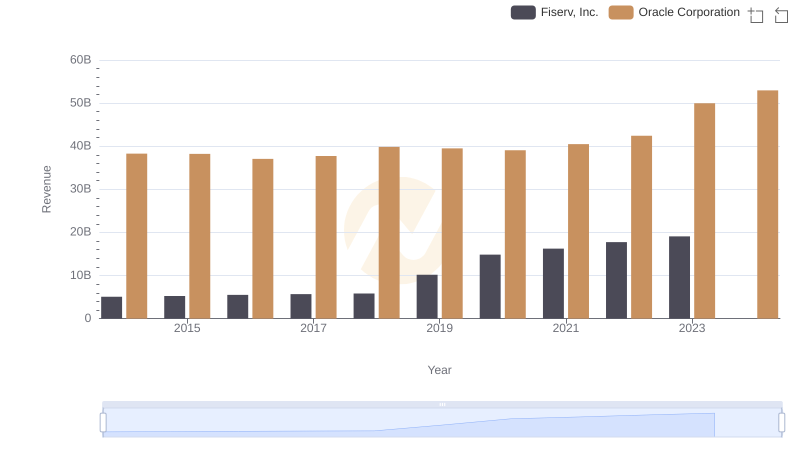
Oracle Corporation vs Fiserv, Inc.: Annual Revenue Growth Compared
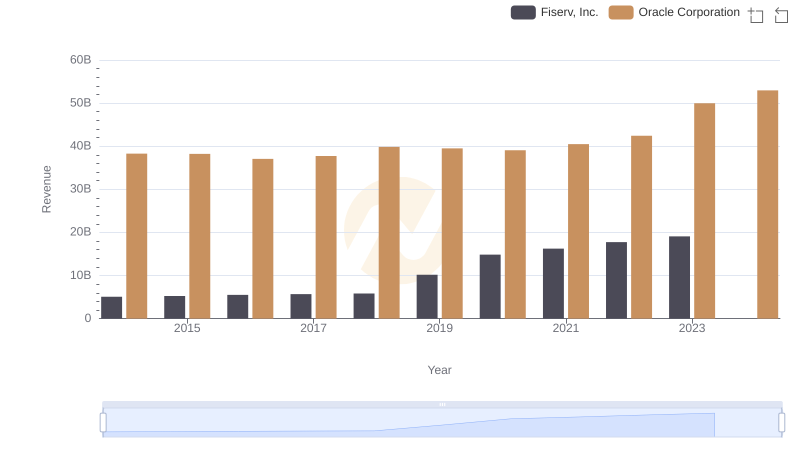
Oracle Corporation and Fiserv, Inc.: A Comprehensive Revenue Analysis
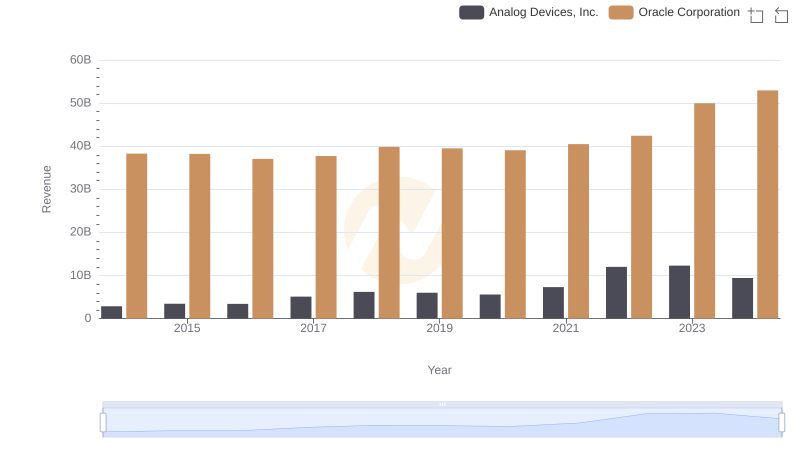
Revenue Insights: Oracle Corporation and Analog Devices, Inc. Performance Compared
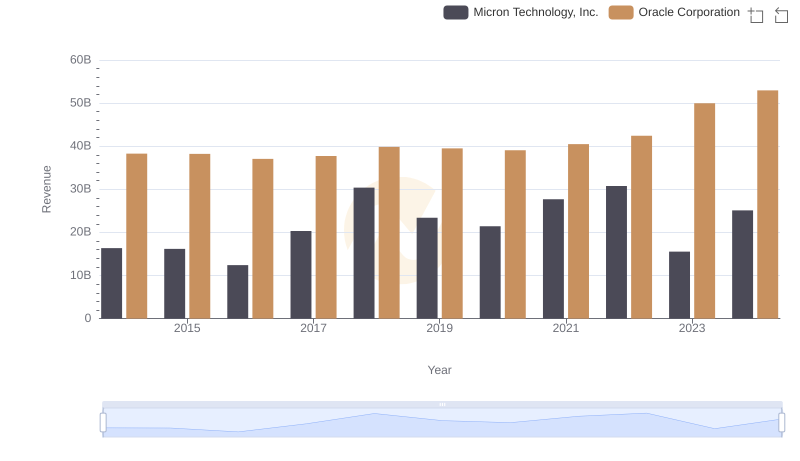
Revenue Showdown: Oracle Corporation vs Micron Technology, Inc.
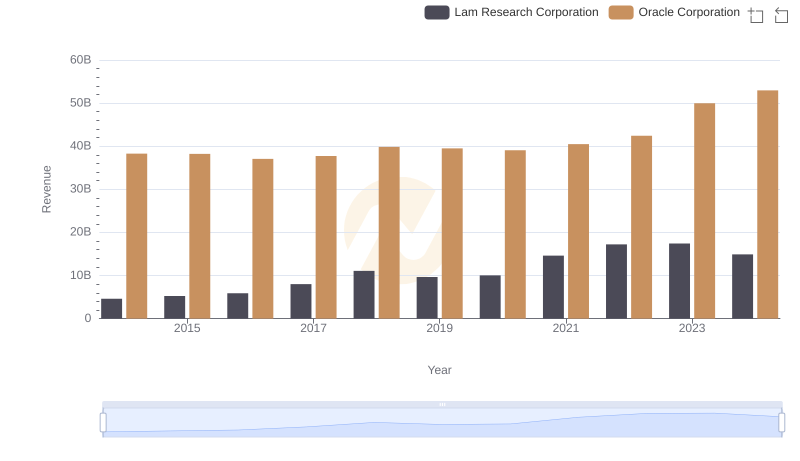
Revenue Insights: Oracle Corporation and Lam Research Corporation Performance Compared
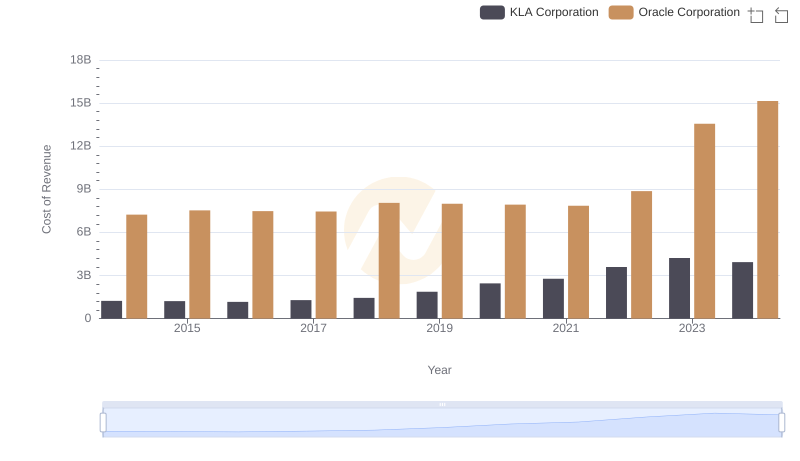
Cost Insights: Breaking Down Oracle Corporation and KLA Corporation's Expenses
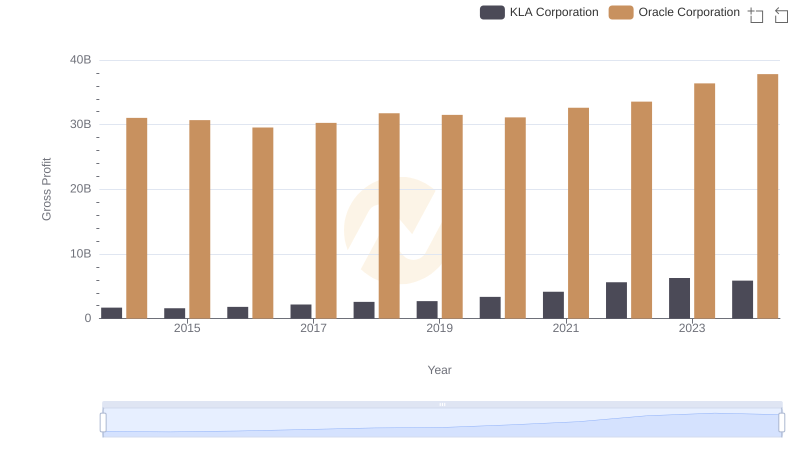
Who Generates Higher Gross Profit? Oracle Corporation or KLA Corporation
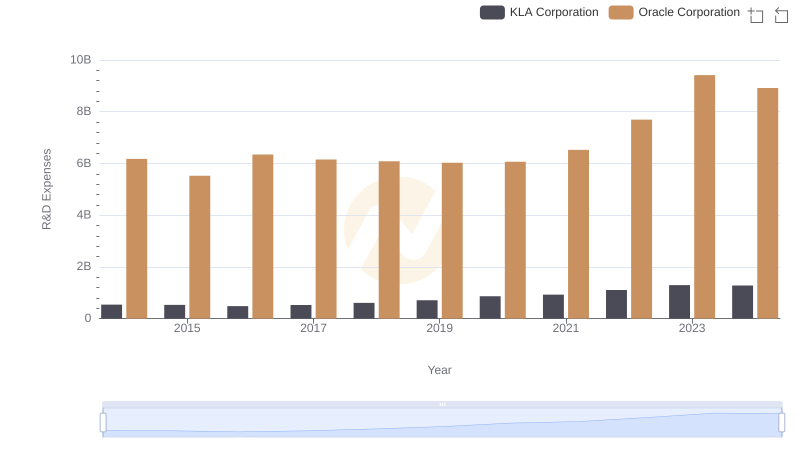
Research and Development Investment: Oracle Corporation vs KLA Corporation
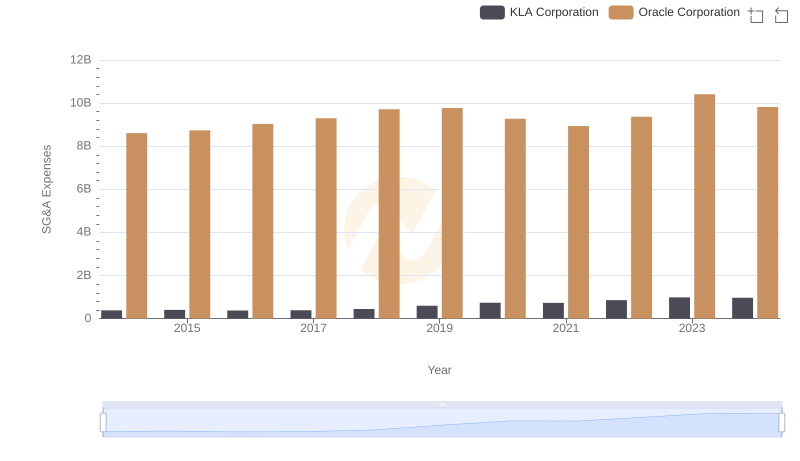
Oracle Corporation vs KLA Corporation: SG&A Expense Trends
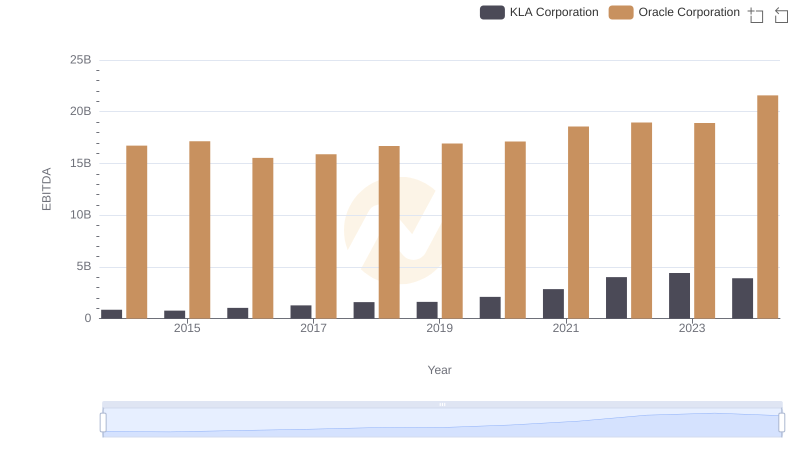
Oracle Corporation and KLA Corporation: A Detailed Examination of EBITDA Performance