| __timestamp | Corpay, Inc. | Nutanix, Inc. |
|---|---|---|
| Wednesday, January 1, 2014 | 1199390000 | 127127000 |
| Thursday, January 1, 2015 | 1702865000 | 241432000 |
| Friday, January 1, 2016 | 1831546000 | 444928000 |
| Sunday, January 1, 2017 | 2249538000 | 766869000 |
| Monday, January 1, 2018 | 2433492000 | 1155457000 |
| Tuesday, January 1, 2019 | 2648848000 | 1236143000 |
| Wednesday, January 1, 2020 | 2388855000 | 1307682000 |
| Friday, January 1, 2021 | 2833736000 | 1394364000 |
| Saturday, January 1, 2022 | 3427129000 | 1580796000 |
| Sunday, January 1, 2023 | 3757719000 | 1862895000 |
| Monday, January 1, 2024 | 3974589000 | 2148816000 |
Infusing magic into the data realm
In the ever-evolving landscape of technology and financial services, Corpay, Inc. and Nutanix, Inc. have emerged as significant players. Over the past decade, Corpay has demonstrated a robust growth trajectory, with its revenue surging by over 213% from 2014 to 2023. This impressive growth reflects Corpay's strategic expansion and adaptation to market demands.
Meanwhile, Nutanix, Inc., a leader in cloud computing solutions, has also shown remarkable progress. From 2014 to 2023, Nutanix's revenue increased by approximately 1,365%, highlighting its rapid ascent in the tech industry. Despite a slower start, Nutanix's innovative solutions have propelled it to new heights.
While Corpay's revenue consistently outpaced Nutanix's, the latter's growth rate underscores its potential to disrupt the market further. As we look to the future, both companies are poised to continue their upward trajectories, albeit with different strategies and market focuses.
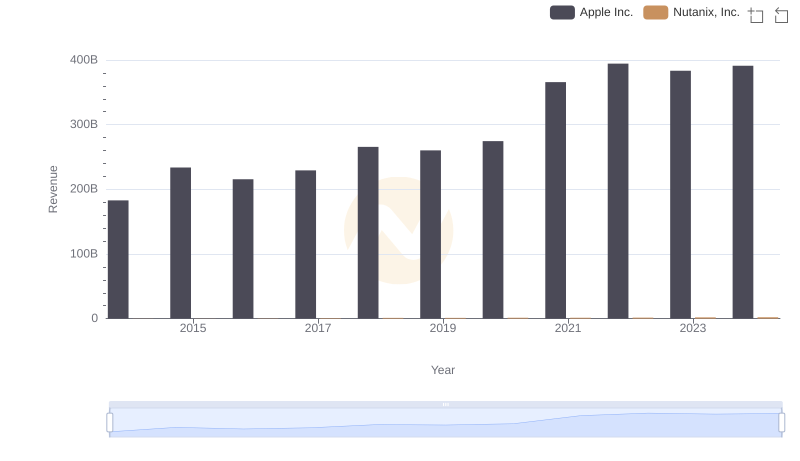
Apple Inc. or Nutanix, Inc.: Who Leads in Yearly Revenue?
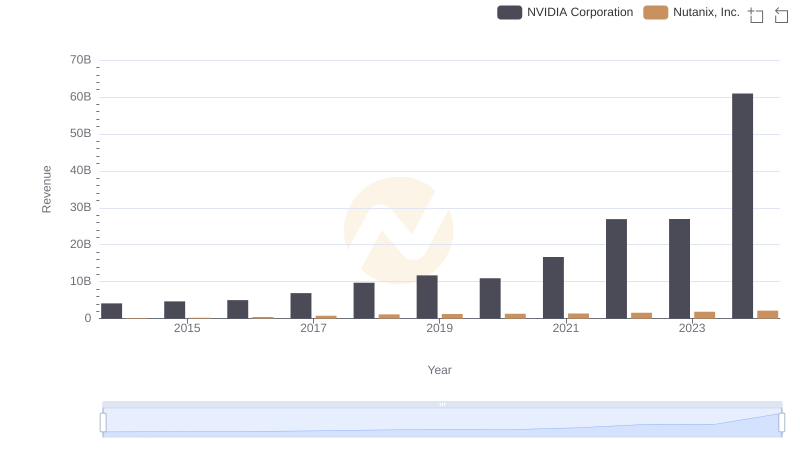
NVIDIA Corporation or Nutanix, Inc.: Who Leads in Yearly Revenue?

Comparing Revenue Performance: Taiwan Semiconductor Manufacturing Company Limited or Corpay, Inc.?
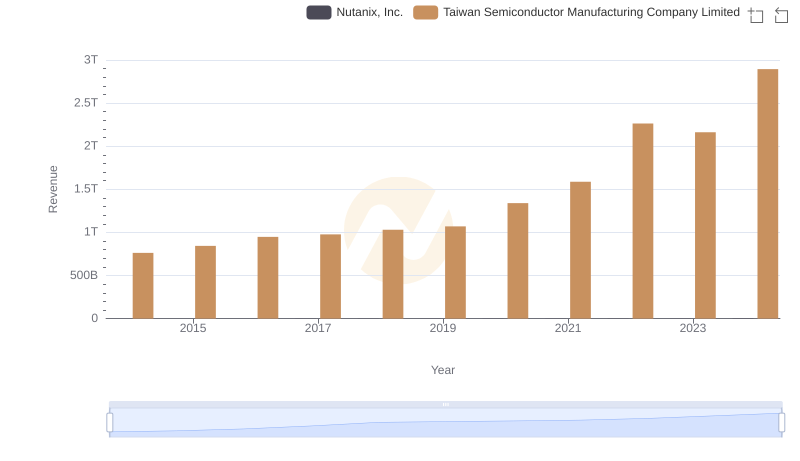
Taiwan Semiconductor Manufacturing Company Limited vs Nutanix, Inc.: Annual Revenue Growth Compared
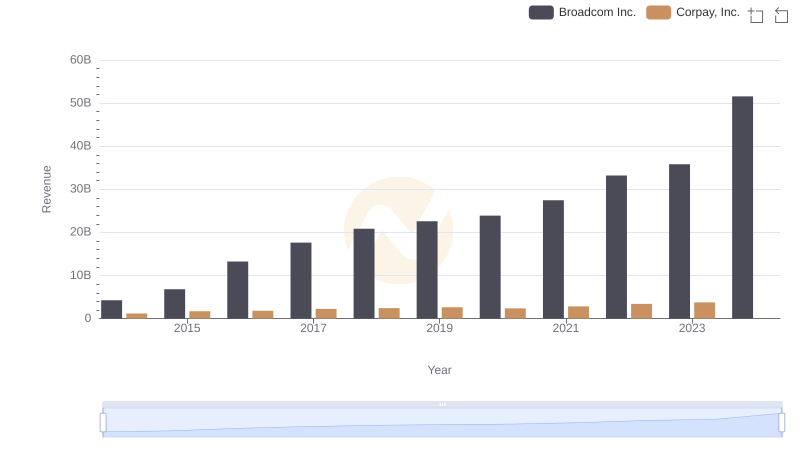
Broadcom Inc. and Corpay, Inc.: A Comprehensive Revenue Analysis
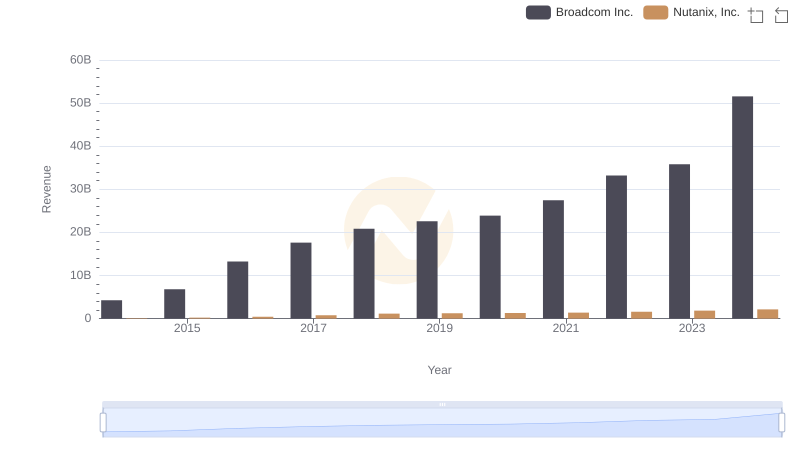
Revenue Insights: Broadcom Inc. and Nutanix, Inc. Performance Compared
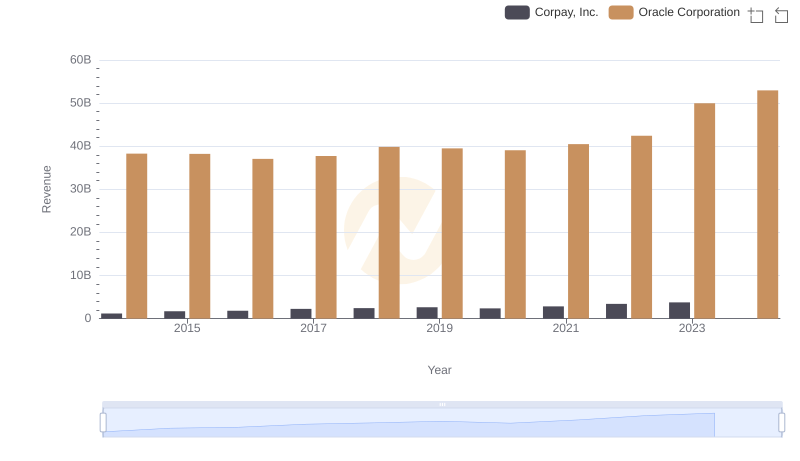
Oracle Corporation vs Corpay, Inc.: Examining Key Revenue Metrics
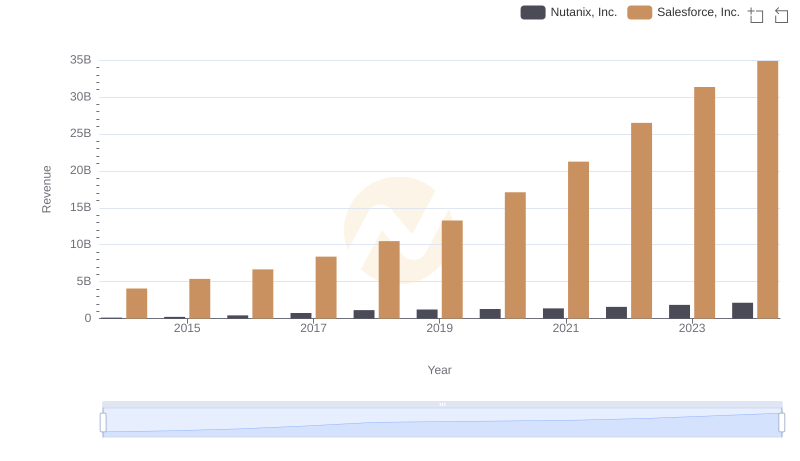
Comparing Revenue Performance: Salesforce, Inc. or Nutanix, Inc.?
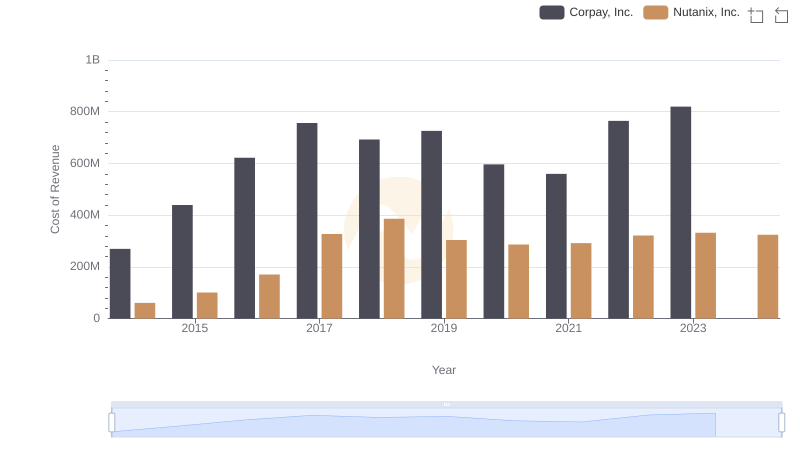
Cost of Revenue: Key Insights for Corpay, Inc. and Nutanix, Inc.
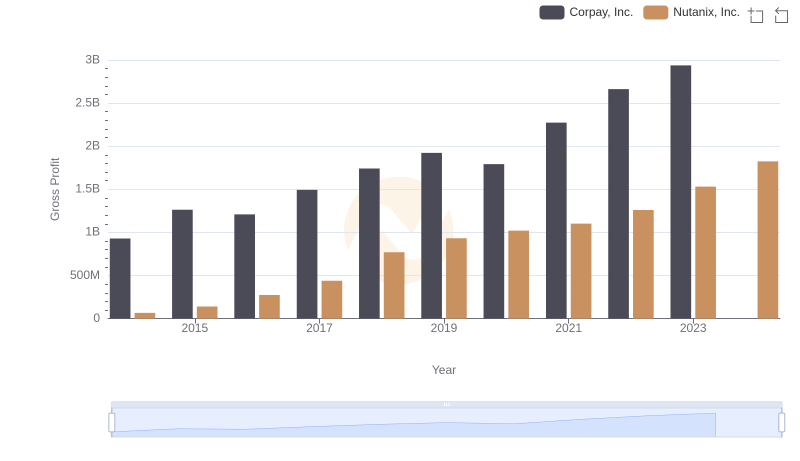
Gross Profit Analysis: Comparing Corpay, Inc. and Nutanix, Inc.
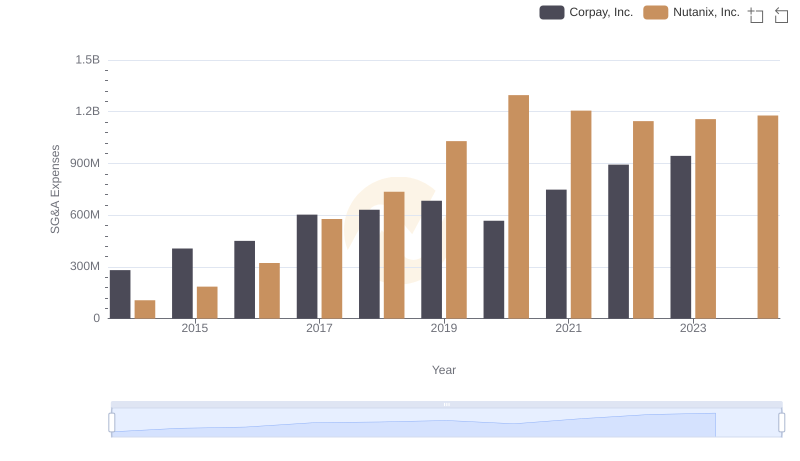
Corpay, Inc. vs Nutanix, Inc.: SG&A Expense Trends