| __timestamp | Fastenal Company | Lockheed Martin Corporation |
|---|---|---|
| Wednesday, January 1, 2014 | 1836105000 | 40226000000 |
| Thursday, January 1, 2015 | 1920253000 | 40830000000 |
| Friday, January 1, 2016 | 1997259000 | 42106000000 |
| Sunday, January 1, 2017 | 2226900000 | 45500000000 |
| Monday, January 1, 2018 | 2566200000 | 46392000000 |
| Tuesday, January 1, 2019 | 2818300000 | 51445000000 |
| Wednesday, January 1, 2020 | 3079500000 | 56744000000 |
| Friday, January 1, 2021 | 3233700000 | 57983000000 |
| Saturday, January 1, 2022 | 3764800000 | 57697000000 |
| Sunday, January 1, 2023 | 3992200000 | 59092000000 |
| Monday, January 1, 2024 | 4144100000 | 64113000000 |
Cracking the code
In the world of aerospace and industrial supplies, Lockheed Martin Corporation and Fastenal Company stand as titans. From 2014 to 2024, these companies have shown distinct trajectories in their cost of revenue. Lockheed Martin, a leader in defense and aerospace, has seen its cost of revenue grow by approximately 60%, reaching a staggering $64 billion by 2024. This reflects its expanding operations and increased defense contracts. Meanwhile, Fastenal, a key player in industrial supplies, has experienced a 126% increase, with costs nearing $4.1 billion in 2024. This growth underscores Fastenal's strategic expansion and market penetration. The data highlights the contrasting scales and growth strategies of these industry leaders, offering insights into their operational efficiencies and market dynamics.

Analyzing Cost of Revenue: Lockheed Martin Corporation and Paychex, Inc.
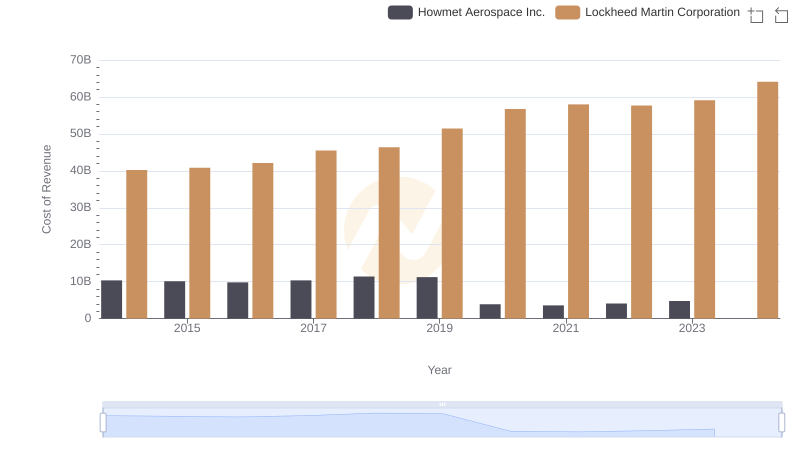
Cost of Revenue: Key Insights for Lockheed Martin Corporation and Howmet Aerospace Inc.

Lockheed Martin Corporation and Fastenal Company: A Comprehensive Revenue Analysis

Comparing Cost of Revenue Efficiency: Lockheed Martin Corporation vs Cummins Inc.
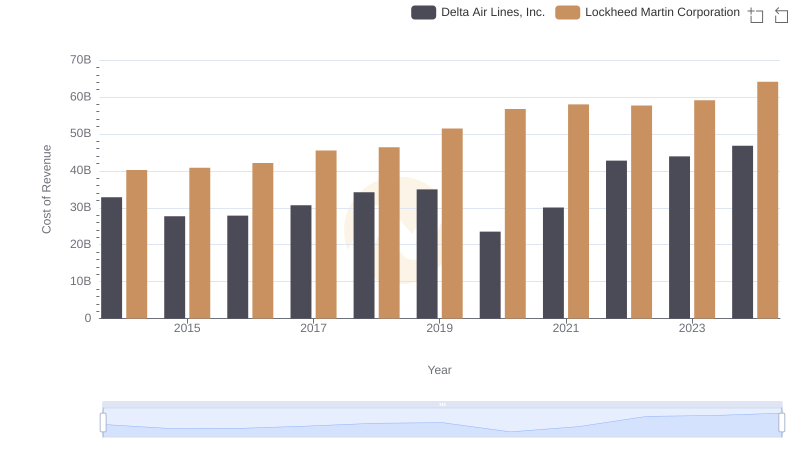
Cost of Revenue: Key Insights for Lockheed Martin Corporation and Delta Air Lines, Inc.
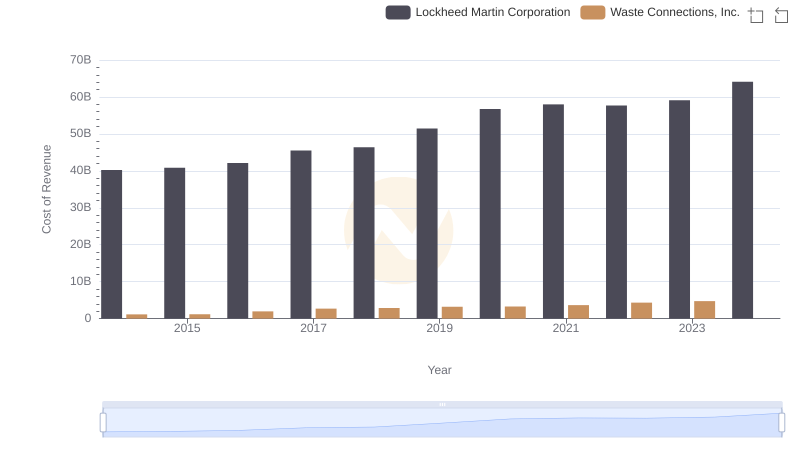
Analyzing Cost of Revenue: Lockheed Martin Corporation and Waste Connections, Inc.
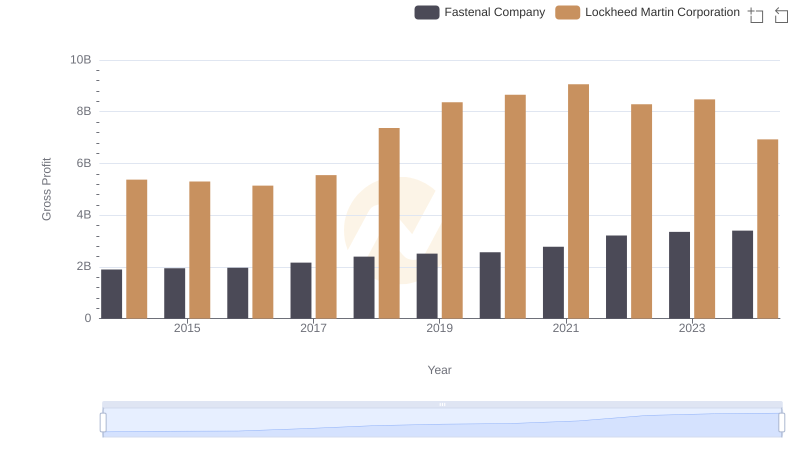
Lockheed Martin Corporation vs Fastenal Company: A Gross Profit Performance Breakdown
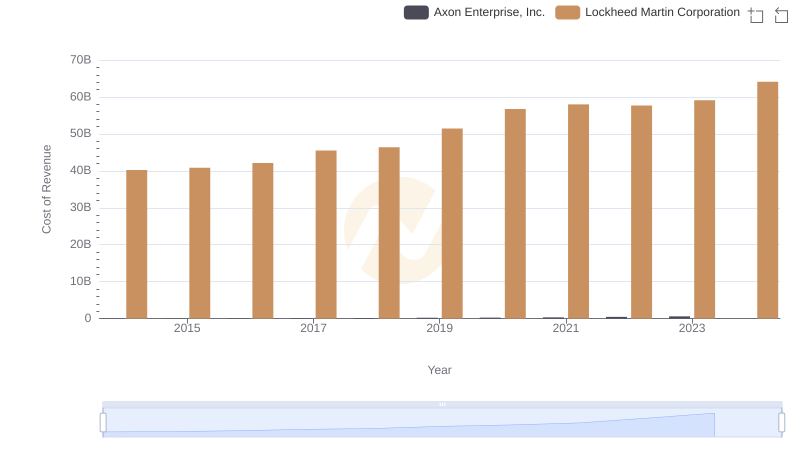
Comparing Cost of Revenue Efficiency: Lockheed Martin Corporation vs Axon Enterprise, Inc.
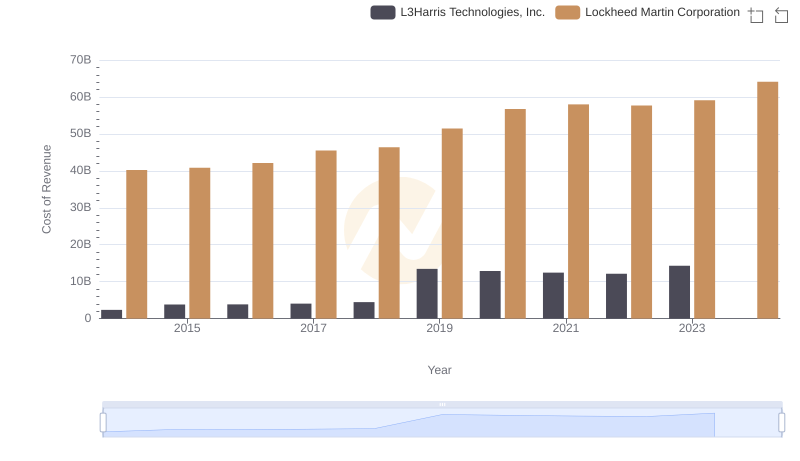
Lockheed Martin Corporation vs L3Harris Technologies, Inc.: Efficiency in Cost of Revenue Explored
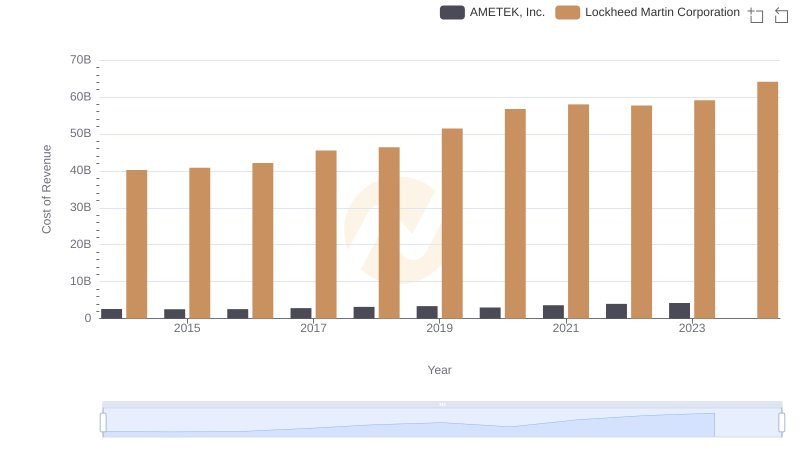
Cost of Revenue: Key Insights for Lockheed Martin Corporation and AMETEK, Inc.
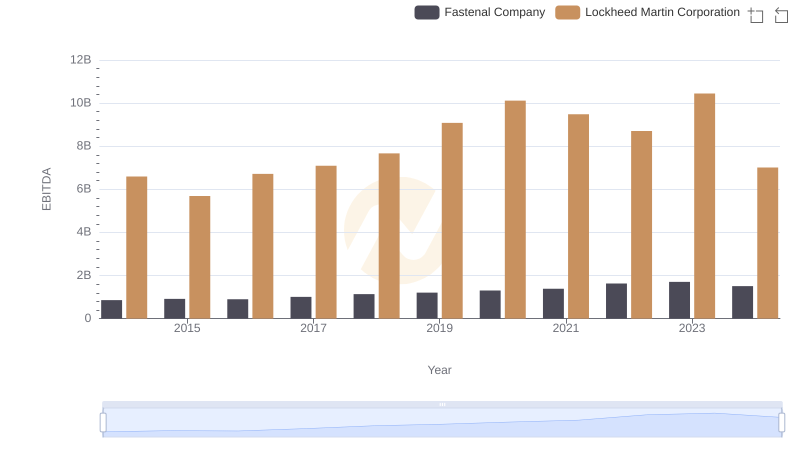
Lockheed Martin Corporation and Fastenal Company: A Detailed Examination of EBITDA Performance