| __timestamp | Accenture plc | Microchip Technology Incorporated |
|---|---|---|
| Wednesday, January 1, 2014 | 4903240000 | 651027000 |
| Thursday, January 1, 2015 | 5071031000 | 731158000 |
| Friday, January 1, 2016 | 6348882000 | 668482000 |
| Sunday, January 1, 2017 | 5433366000 | 705341000 |
| Monday, January 1, 2018 | 6754408000 | 1552200000 |
| Tuesday, January 1, 2019 | 7167520000 | 1624400000 |
| Wednesday, January 1, 2020 | 7986088000 | 1909400000 |
| Friday, January 1, 2021 | 7621529000 | 2153100000 |
| Saturday, January 1, 2022 | 10554225000 | 3022600000 |
| Sunday, January 1, 2023 | 10587612000 | 4112000000 |
| Monday, January 1, 2024 | 11188334000 | 3438200000 |
Unlocking the unknown
In the ever-evolving landscape of technology and consulting, Accenture plc and Microchip Technology Incorporated have demonstrated remarkable financial trajectories over the past decade. From 2014 to 2024, Accenture's EBITDA has surged by approximately 128%, reflecting its robust growth strategy and market adaptability. In contrast, Microchip Technology has experienced a significant 428% increase in EBITDA, showcasing its dynamic expansion in the semiconductor industry.
This side-by-side analysis underscores the diverse growth strategies of these industry giants, offering valuable insights into their financial health and market positioning.
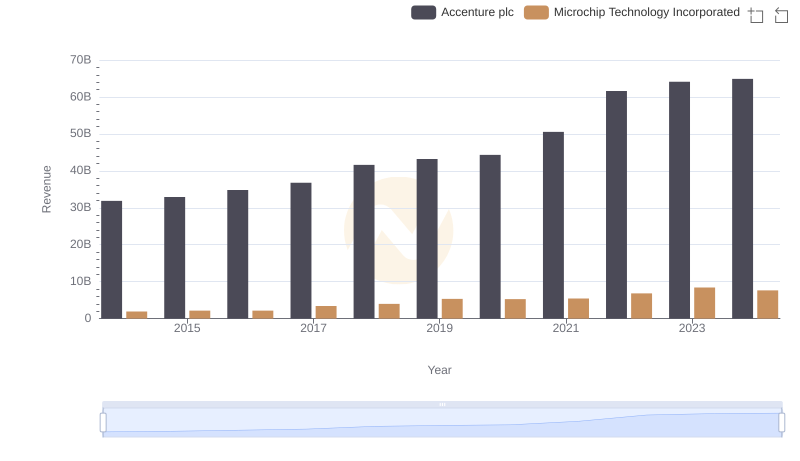
Who Generates More Revenue? Accenture plc or Microchip Technology Incorporated
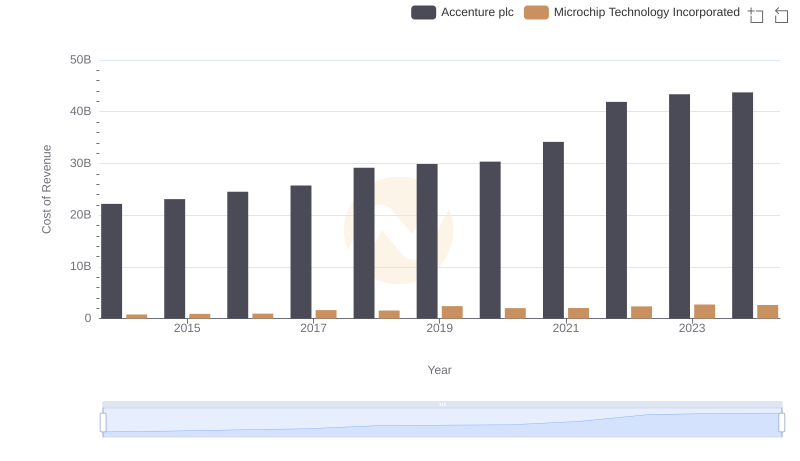
Comparing Cost of Revenue Efficiency: Accenture plc vs Microchip Technology Incorporated
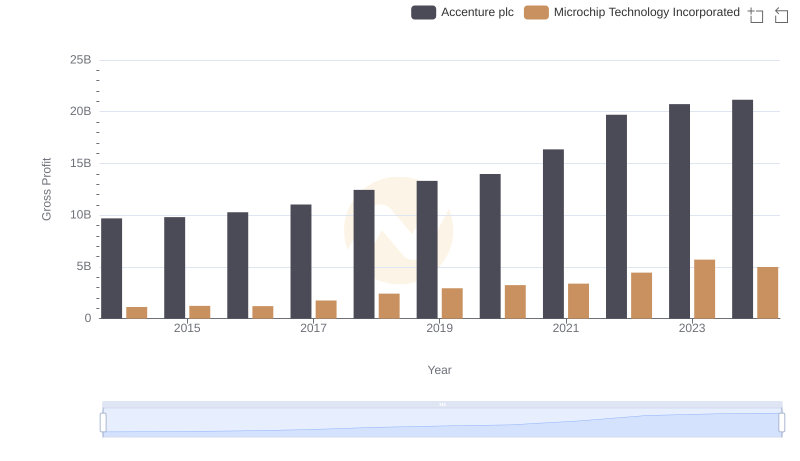
Accenture plc and Microchip Technology Incorporated: A Detailed Gross Profit Analysis
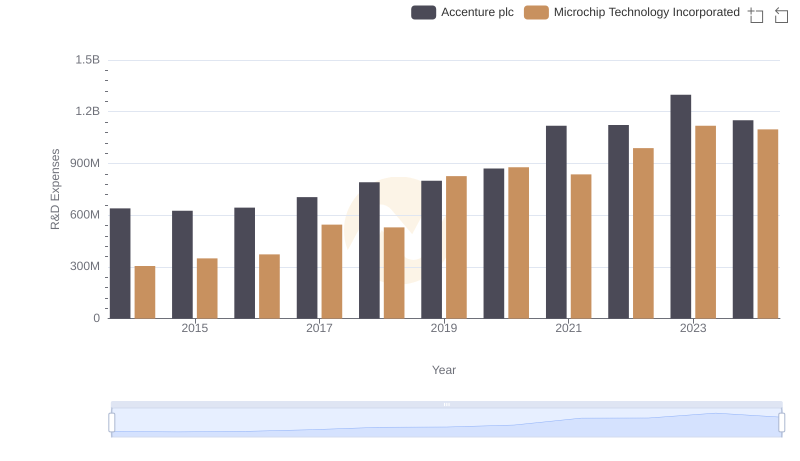
R&D Spending Showdown: Accenture plc vs Microchip Technology Incorporated
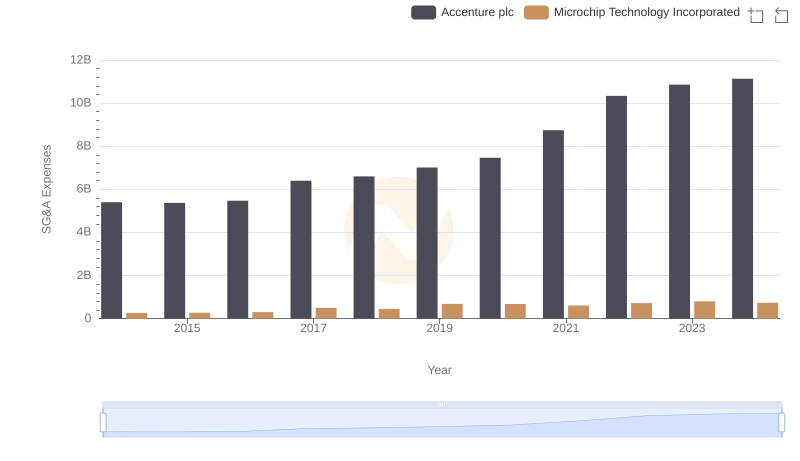
Accenture plc and Microchip Technology Incorporated: SG&A Spending Patterns Compared
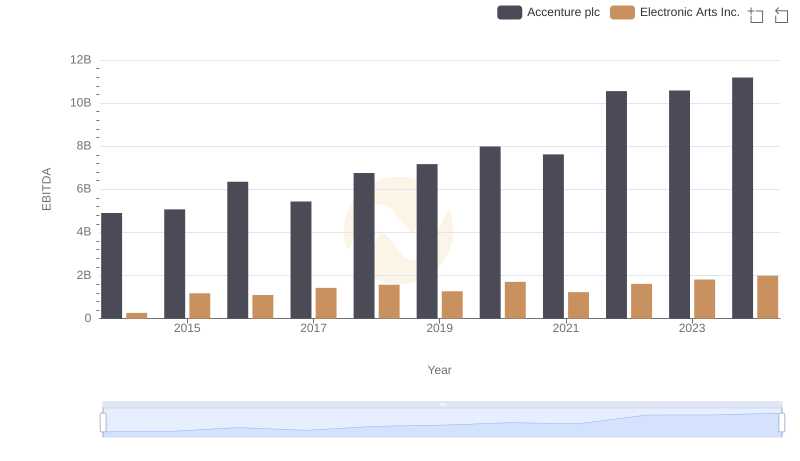
A Side-by-Side Analysis of EBITDA: Accenture plc and Electronic Arts Inc.
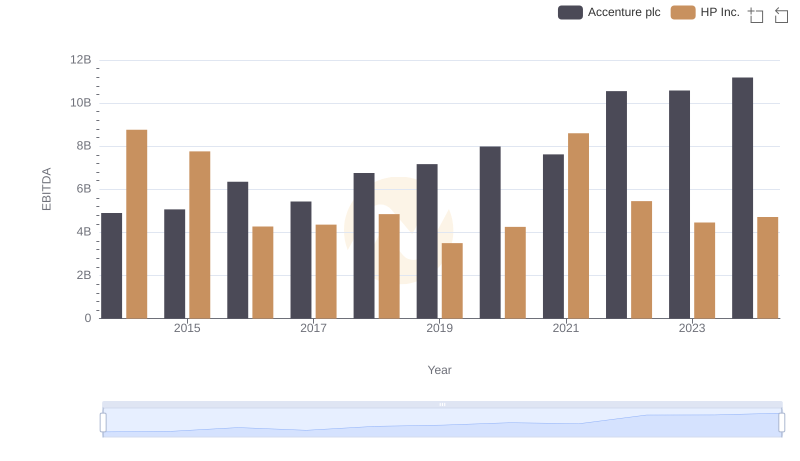
Comparative EBITDA Analysis: Accenture plc vs HP Inc.
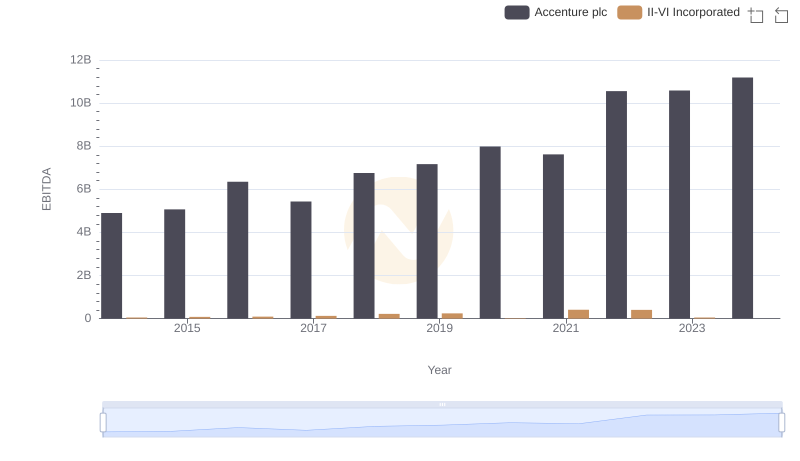
Comparative EBITDA Analysis: Accenture plc vs II-VI Incorporated
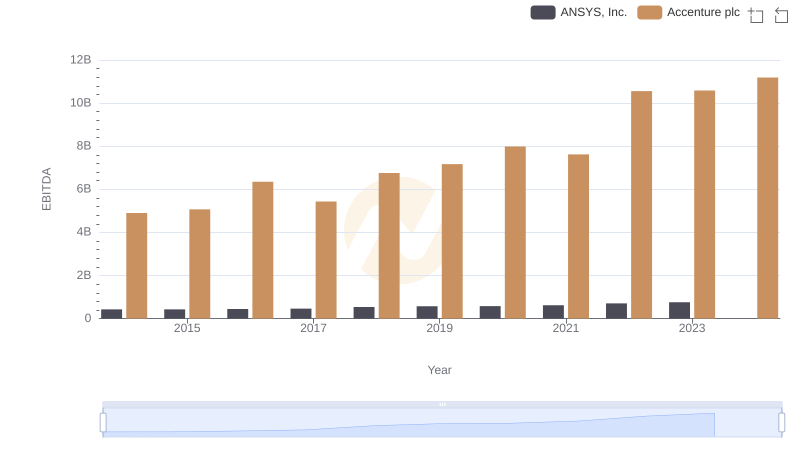
Accenture plc vs ANSYS, Inc.: In-Depth EBITDA Performance Comparison
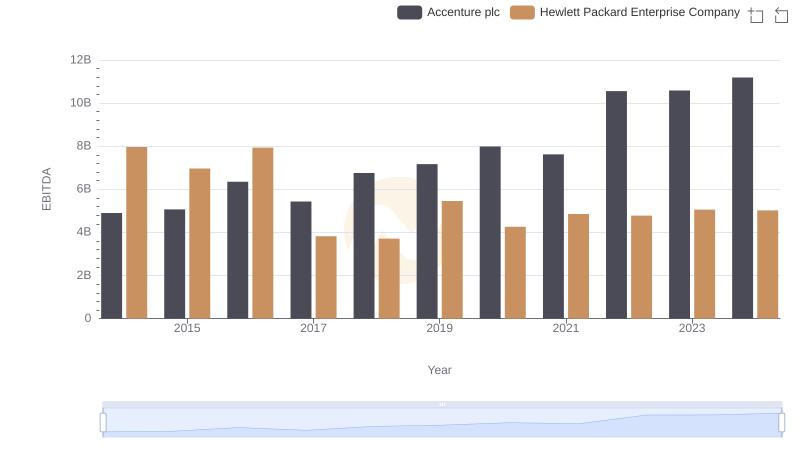
Comprehensive EBITDA Comparison: Accenture plc vs Hewlett Packard Enterprise Company
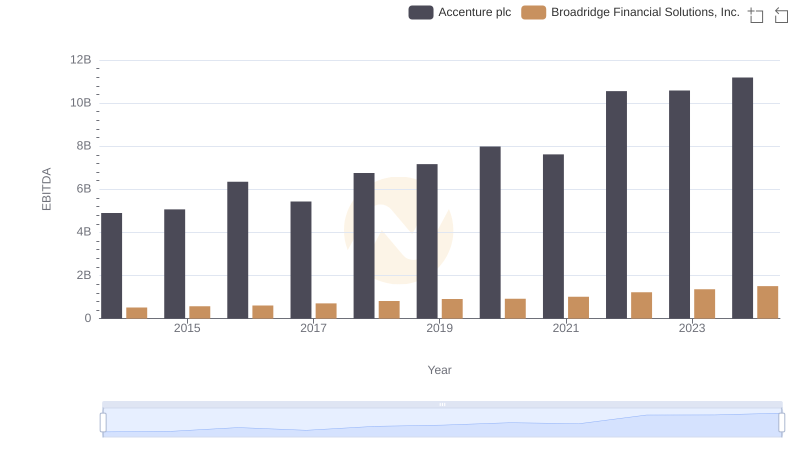
EBITDA Performance Review: Accenture plc vs Broadridge Financial Solutions, Inc.
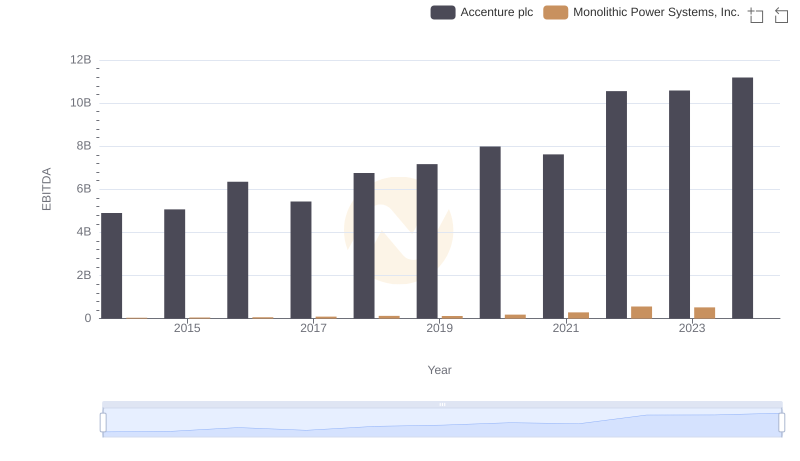
A Side-by-Side Analysis of EBITDA: Accenture plc and Monolithic Power Systems, Inc.