| __timestamp | Accenture plc | Manhattan Associates, Inc. |
|---|---|---|
| Wednesday, January 1, 2014 | 4903240000 | 133501000 |
| Thursday, January 1, 2015 | 5071031000 | 169210000 |
| Friday, January 1, 2016 | 6348882000 | 203397000 |
| Sunday, January 1, 2017 | 5433366000 | 197626000 |
| Monday, January 1, 2018 | 6754408000 | 142500000 |
| Tuesday, January 1, 2019 | 7167520000 | 123911000 |
| Wednesday, January 1, 2020 | 7986088000 | 123007000 |
| Friday, January 1, 2021 | 7621529000 | 142247000 |
| Saturday, January 1, 2022 | 10554225000 | 159363000 |
| Sunday, January 1, 2023 | 10587612000 | 215633000 |
| Monday, January 1, 2024 | 11188334000 | 267897000 |
In pursuit of knowledge
In the ever-evolving landscape of global business, understanding the financial health of industry leaders is crucial. This analysis delves into the EBITDA performance of Accenture plc and Manhattan Associates, Inc. from 2014 to 2024. Over this decade, Accenture has demonstrated a robust growth trajectory, with its EBITDA increasing by approximately 128%, from $4.9 billion in 2014 to an impressive $11.2 billion in 2024. In contrast, Manhattan Associates, while smaller in scale, has shown a steady rise of around 105%, growing from $133 million to $273 million over the same period. This side-by-side comparison highlights Accenture's dominant market position, yet underscores Manhattan's consistent growth in a competitive environment. As businesses navigate the complexities of the modern economy, these insights provide valuable perspectives on strategic financial management.
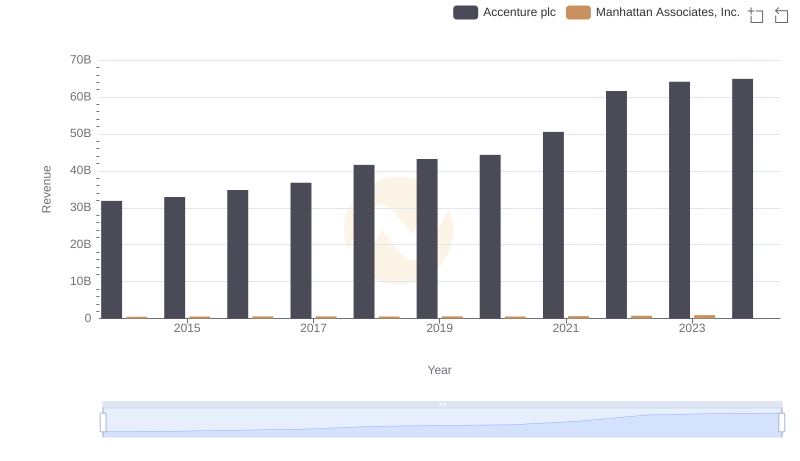
Accenture plc vs Manhattan Associates, Inc.: Annual Revenue Growth Compared
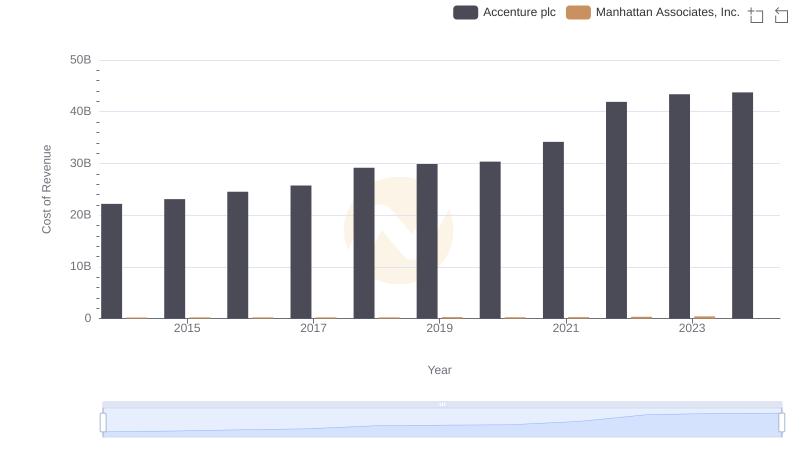
Cost Insights: Breaking Down Accenture plc and Manhattan Associates, Inc.'s Expenses
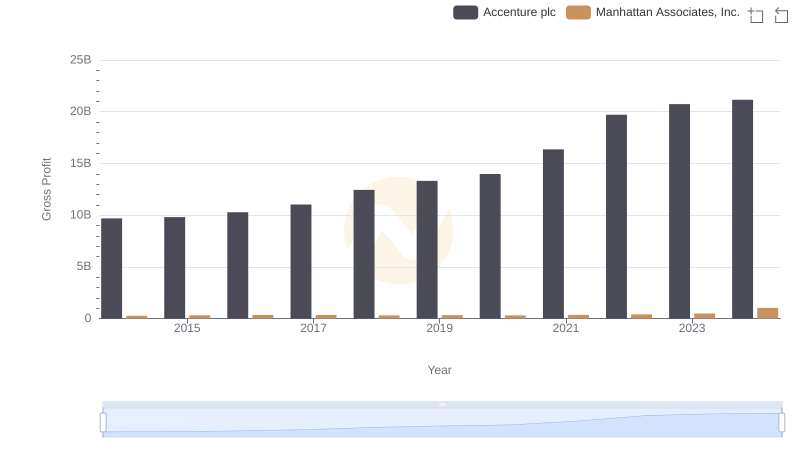
Gross Profit Analysis: Comparing Accenture plc and Manhattan Associates, Inc.
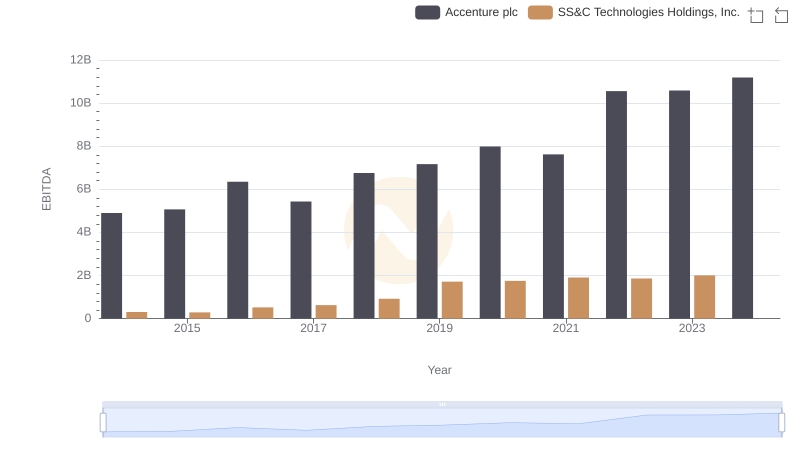
A Professional Review of EBITDA: Accenture plc Compared to SS&C Technologies Holdings, Inc.

Comparative EBITDA Analysis: Accenture plc vs VeriSign, Inc.
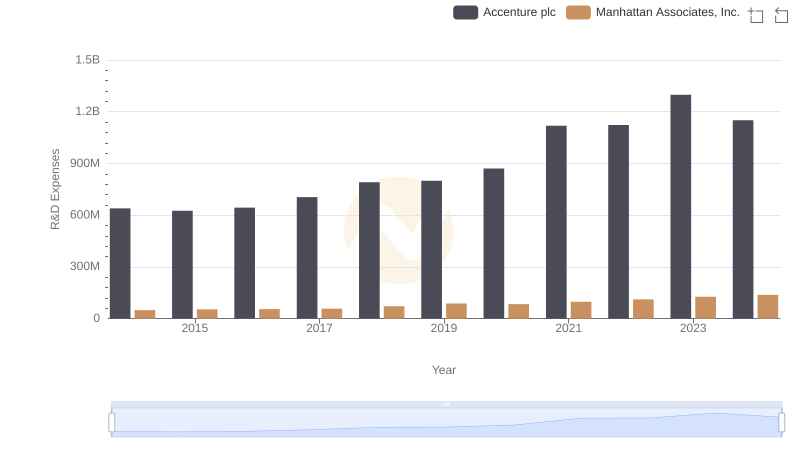
Who Prioritizes Innovation? R&D Spending Compared for Accenture plc and Manhattan Associates, Inc.
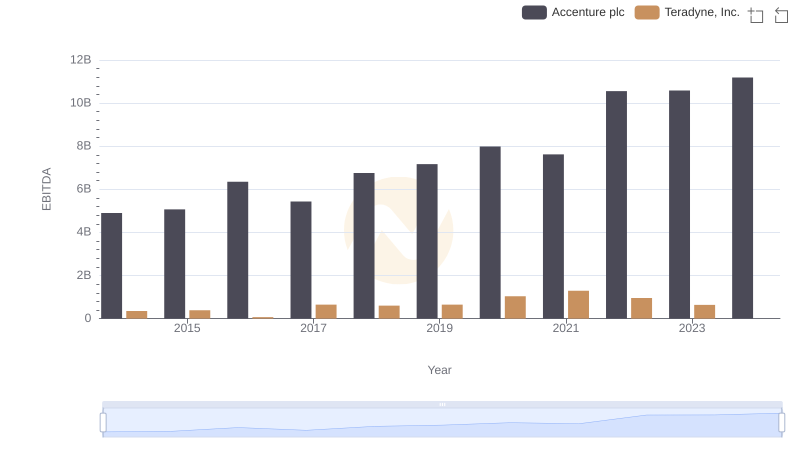
EBITDA Performance Review: Accenture plc vs Teradyne, Inc.
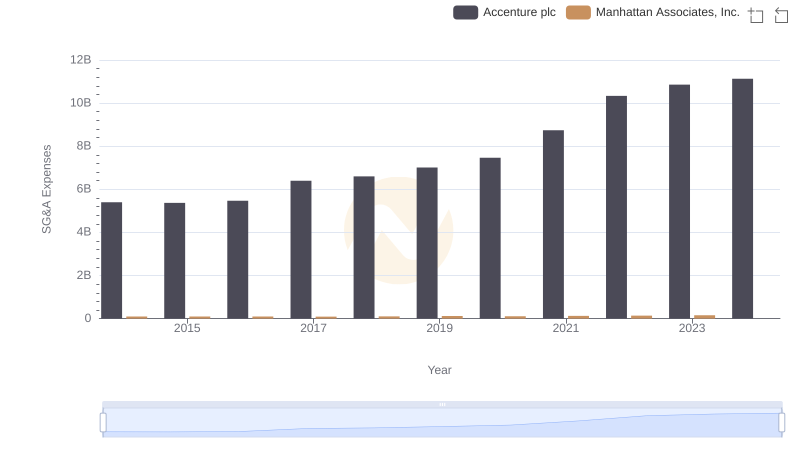
Breaking Down SG&A Expenses: Accenture plc vs Manhattan Associates, Inc.
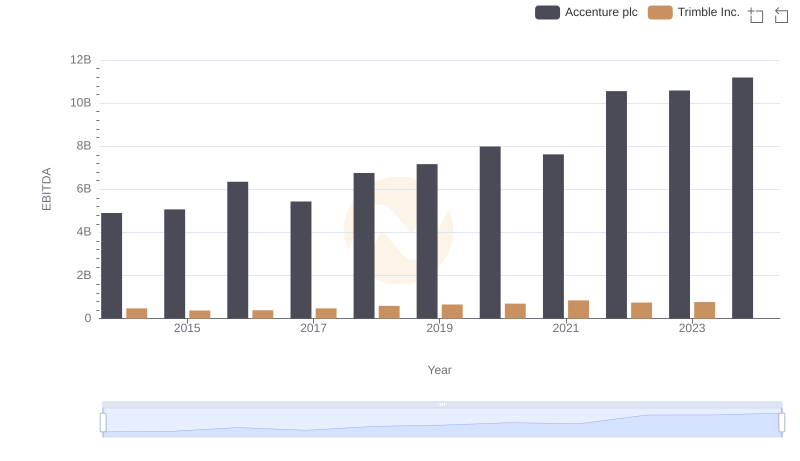
A Side-by-Side Analysis of EBITDA: Accenture plc and Trimble Inc.
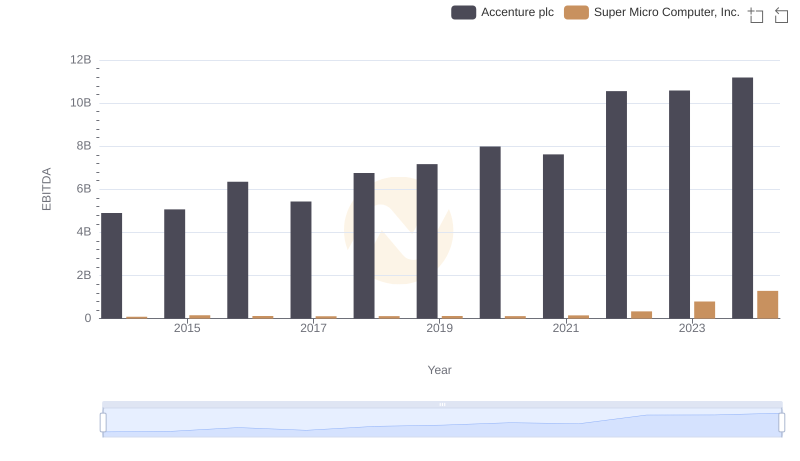
Accenture plc vs Super Micro Computer, Inc.: In-Depth EBITDA Performance Comparison
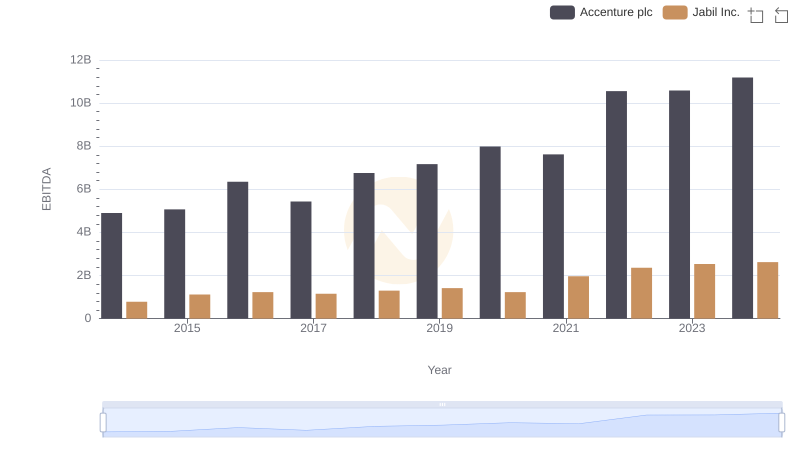
EBITDA Analysis: Evaluating Accenture plc Against Jabil Inc.
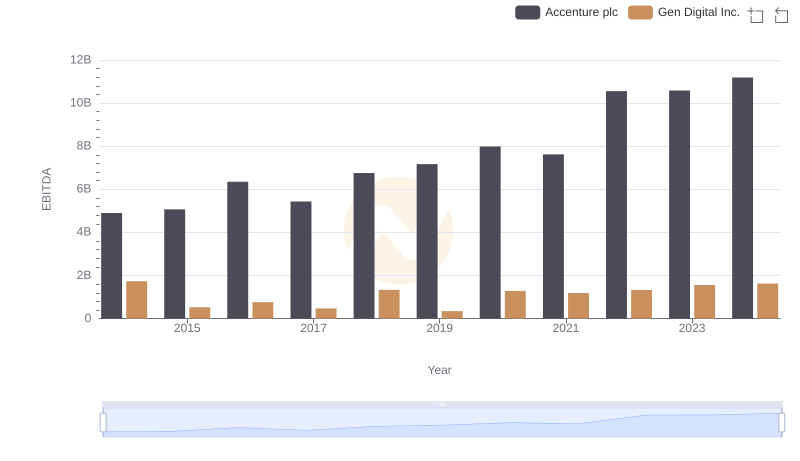
Accenture plc vs Gen Digital Inc.: In-Depth EBITDA Performance Comparison