| __timestamp | Nordson Corporation | RTX Corporation |
|---|---|---|
| Wednesday, January 1, 2014 | 427302000 | 11567000000 |
| Thursday, January 1, 2015 | 384160000 | 9275000000 |
| Friday, January 1, 2016 | 460120000 | 10177000000 |
| Sunday, January 1, 2017 | 547746000 | 10792000000 |
| Monday, January 1, 2018 | 606502000 | 11721000000 |
| Tuesday, January 1, 2019 | 588493000 | 8298000000 |
| Wednesday, January 1, 2020 | 446951000 | 2947000000 |
| Friday, January 1, 2021 | 703550000 | 10556000000 |
| Saturday, January 1, 2022 | 771615000 | 11174000000 |
| Sunday, January 1, 2023 | 786742000 | 9611000000 |
| Monday, January 1, 2024 | 674001000 | 12528000000 |
Infusing magic into the data realm
In the ever-evolving landscape of industrial giants, RTX Corporation and Nordson Corporation have showcased intriguing financial trajectories over the past decade. From 2014 to 2024, RTX Corporation's EBITDA has seen a rollercoaster ride, peaking in 2018 with a staggering 11.7 billion, only to dip significantly in 2020 to 2.9 billion, reflecting the global economic challenges of that year. Meanwhile, Nordson Corporation, though smaller in scale, has demonstrated a more consistent growth pattern, with its EBITDA increasing by approximately 83% from 2014 to 2023.
As we look to the future, these trends offer valuable insights into the strategic maneuvers of these industrial titans.
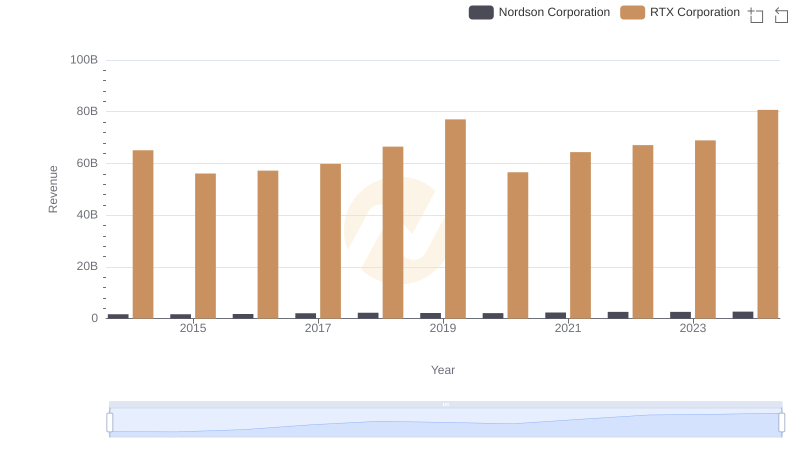
Revenue Showdown: RTX Corporation vs Nordson Corporation
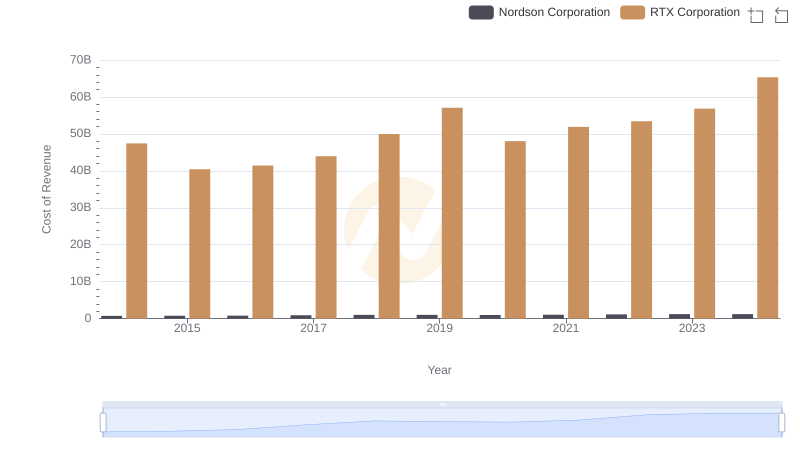
Cost of Revenue Trends: RTX Corporation vs Nordson Corporation
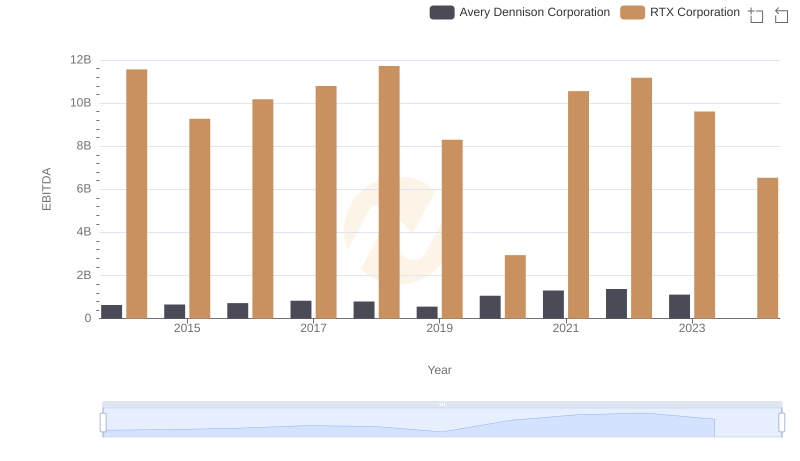
RTX Corporation vs Avery Dennison Corporation: In-Depth EBITDA Performance Comparison

Who Optimizes SG&A Costs Better? RTX Corporation or Nordson Corporation
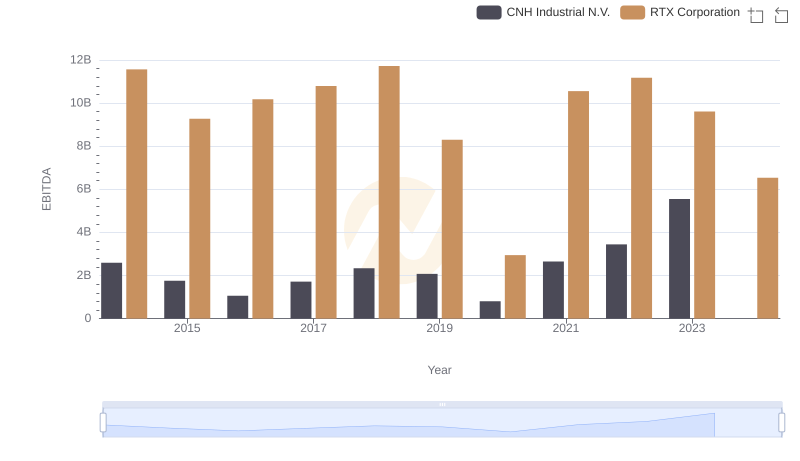
Comparative EBITDA Analysis: RTX Corporation vs CNH Industrial N.V.

A Professional Review of EBITDA: RTX Corporation Compared to U-Haul Holding Company

RTX Corporation vs Comfort Systems USA, Inc.: In-Depth EBITDA Performance Comparison
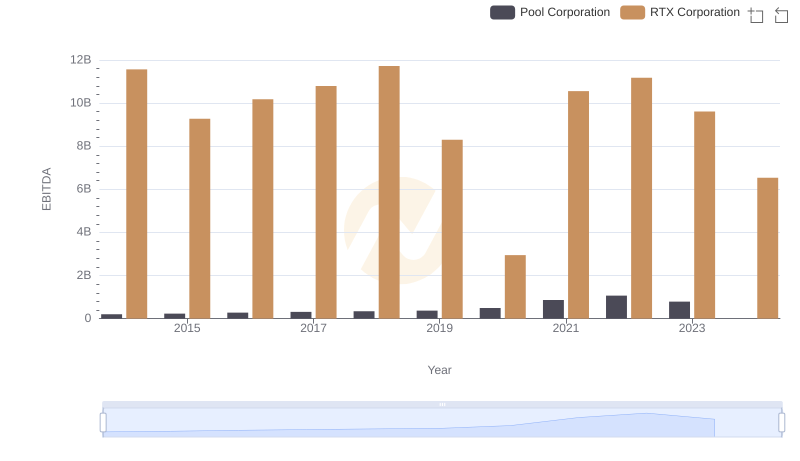
Professional EBITDA Benchmarking: RTX Corporation vs Pool Corporation
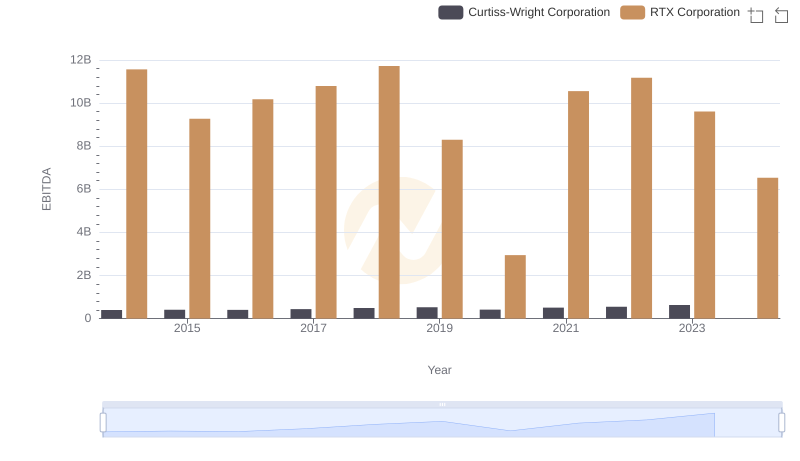
RTX Corporation and Curtiss-Wright Corporation: A Detailed Examination of EBITDA Performance