| __timestamp | Deere & Company | Illinois Tool Works Inc. |
|---|---|---|
| Wednesday, January 1, 2014 | 6912900000 | 3453000000 |
| Thursday, January 1, 2015 | 5196500000 | 3420000000 |
| Friday, January 1, 2016 | 4697500000 | 3534000000 |
| Sunday, January 1, 2017 | 5295800000 | 3861000000 |
| Monday, January 1, 2018 | 6613400000 | 4065000000 |
| Tuesday, January 1, 2019 | 8135000000 | 3852000000 |
| Wednesday, January 1, 2020 | 7721000000 | 3322000000 |
| Friday, January 1, 2021 | 10410000000 | 3910000000 |
| Saturday, January 1, 2022 | 11030000000 | 4241000000 |
| Sunday, January 1, 2023 | 17036000000 | 4484000000 |
| Monday, January 1, 2024 | 14672000000 | 4264000000 |
Igniting the spark of knowledge
In the ever-evolving landscape of industrial giants, Deere & Company and Illinois Tool Works Inc. have consistently demonstrated their prowess. Over the past decade, Deere & Company has shown a remarkable growth trajectory in EBITDA, with a staggering 146% increase from 2014 to 2023. In contrast, Illinois Tool Works Inc. has maintained a steady EBITDA, peaking in 2023 with a 30% increase from its 2014 figures.
This analysis underscores the dynamic nature of the industrial sector, highlighting the importance of strategic innovation and market responsiveness.
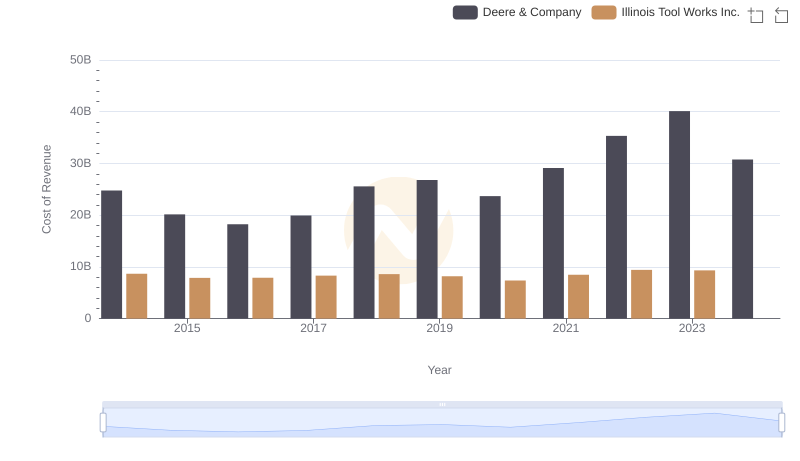
Cost of Revenue: Key Insights for Deere & Company and Illinois Tool Works Inc.
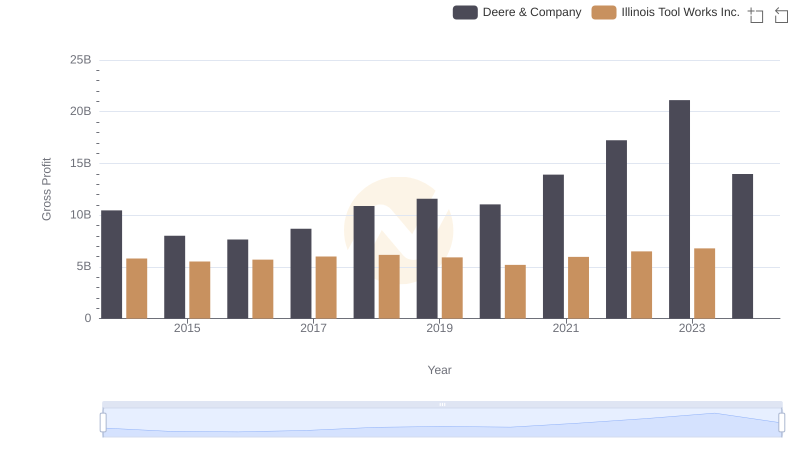
Key Insights on Gross Profit: Deere & Company vs Illinois Tool Works Inc.
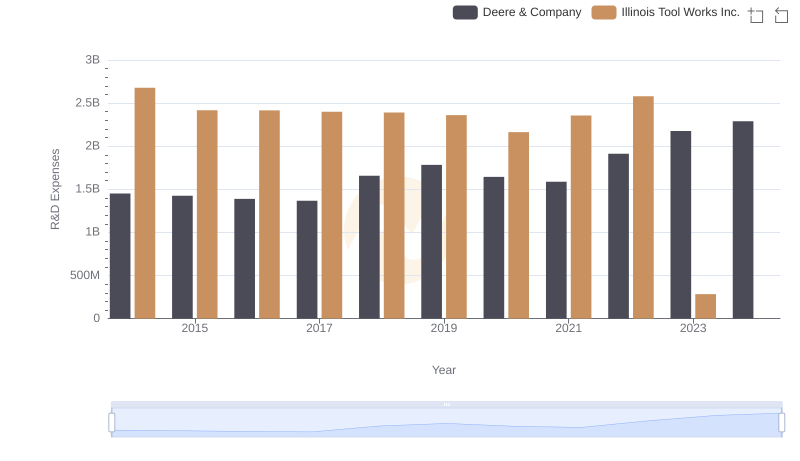
Deere & Company or Illinois Tool Works Inc.: Who Invests More in Innovation?
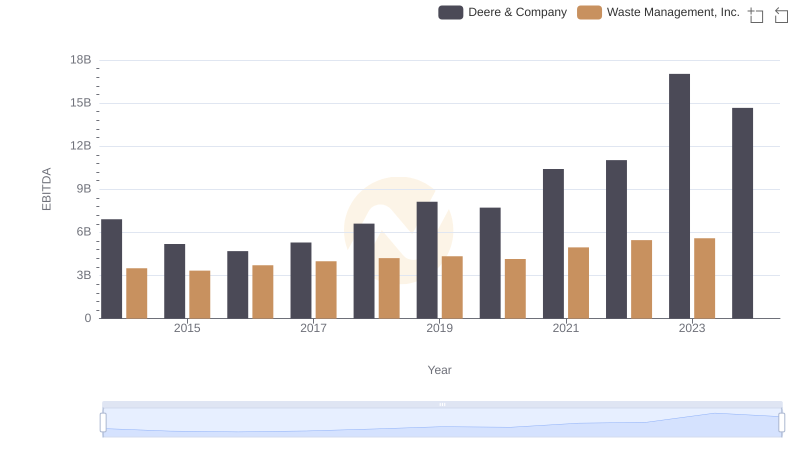
A Professional Review of EBITDA: Deere & Company Compared to Waste Management, Inc.
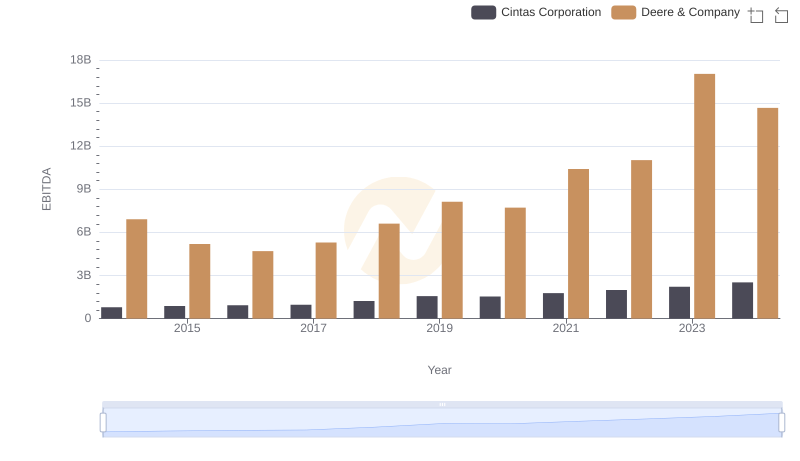
Deere & Company vs Cintas Corporation: In-Depth EBITDA Performance Comparison
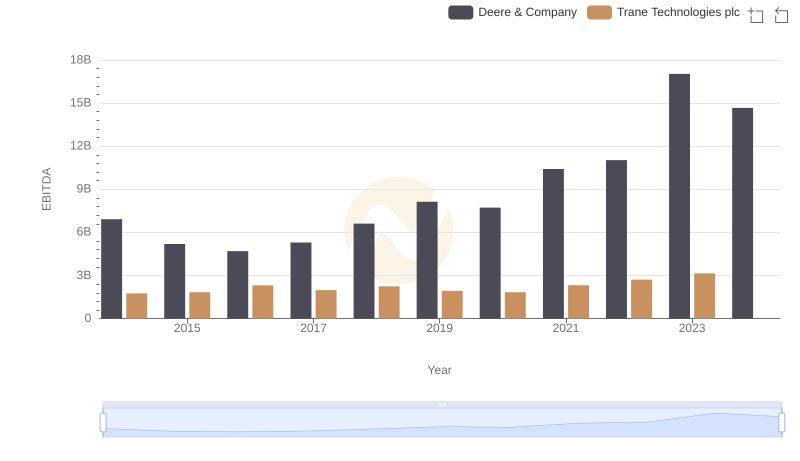
Comparative EBITDA Analysis: Deere & Company vs Trane Technologies plc
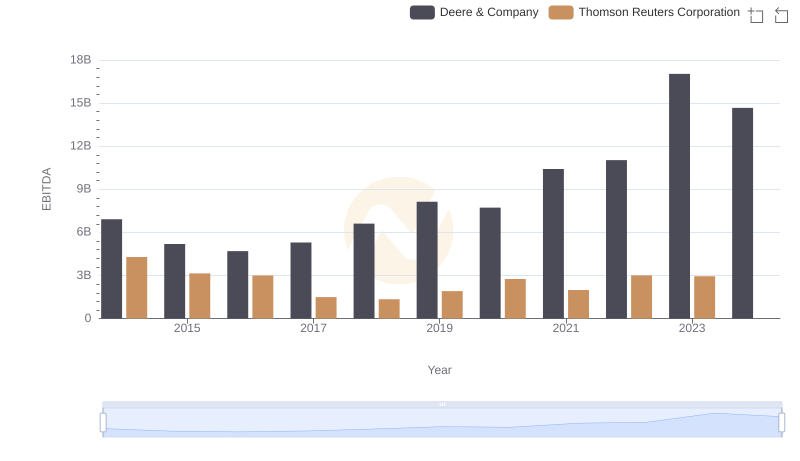
A Professional Review of EBITDA: Deere & Company Compared to Thomson Reuters Corporation