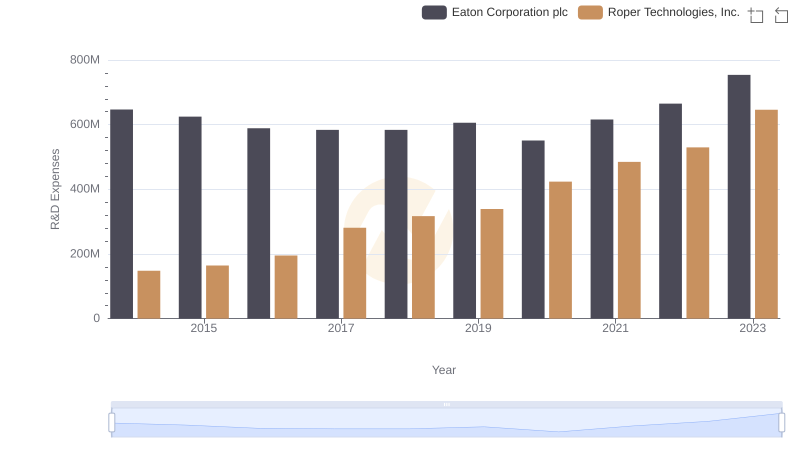
| __timestamp | Eaton Corporation plc | PACCAR Inc |
|---|---|---|
| Wednesday, January 1, 2014 | 647000000 | 215600000 |
| Thursday, January 1, 2015 | 625000000 | 239800000 |
| Friday, January 1, 2016 | 589000000 | 247200000 |
| Sunday, January 1, 2017 | 584000000 | 264700000 |
| Monday, January 1, 2018 | 584000000 | 306100000 |
| Tuesday, January 1, 2019 | 606000000 | 326600000 |
| Wednesday, January 1, 2020 | 551000000 | 273900000 |
| Friday, January 1, 2021 | 616000000 | 324100000 |
| Saturday, January 1, 2022 | 665000000 | 341200000 |
| Sunday, January 1, 2023 | 754000000 | 410900000 |
| Monday, January 1, 2024 | 794000000 | 452900000 |
Data in motion
In the ever-evolving landscape of industrial innovation, research and development (R&D) spending is a critical indicator of a company's commitment to future growth. Over the past decade, Eaton Corporation plc and PACCAR Inc have demonstrated distinct strategies in their R&D allocations. From 2014 to 2023, Eaton consistently invested more in R&D, with a notable 16% increase from 2022 to 2023, reaching its peak. In contrast, PACCAR Inc showed a steady upward trend, culminating in a 21% rise in 2023 compared to 2014. This divergence highlights Eaton's aggressive push in recent years, while PACCAR's gradual increase reflects a more conservative approach. Interestingly, Eaton's data for 2024 is missing, leaving room for speculation on its future strategy. As these industrial giants continue to innovate, their R&D investments will be pivotal in shaping their competitive edge.