| __timestamp | Corning Incorporated | International Business Machines Corporation |
|---|---|---|
| Wednesday, January 1, 2014 | 9715000000 | 92793000000 |
| Thursday, January 1, 2015 | 9111000000 | 81742000000 |
| Friday, January 1, 2016 | 9390000000 | 79920000000 |
| Sunday, January 1, 2017 | 10116000000 | 79139000000 |
| Monday, January 1, 2018 | 11290000000 | 79591000000 |
| Tuesday, January 1, 2019 | 11503000000 | 57714000000 |
| Wednesday, January 1, 2020 | 11303000000 | 55179000000 |
| Friday, January 1, 2021 | 14082000000 | 57351000000 |
| Saturday, January 1, 2022 | 14189000000 | 60530000000 |
| Sunday, January 1, 2023 | 12588000000 | 61860000000 |
| Monday, January 1, 2024 | 13118000000 | 62753000000 |
Unleashing insights
In the ever-evolving landscape of technology and innovation, International Business Machines Corporation (IBM) and Corning Incorporated stand as titans with distinct paths. From 2014 to 2024, these companies have navigated the financial seas with varying fortunes. IBM, a stalwart in the tech industry, saw its revenue peak in 2014, only to experience a gradual decline, dropping by approximately 32% by 2021. However, a modest recovery is evident, with a 9% increase from 2021 to 2024.
Conversely, Corning, renowned for its glass and ceramics expertise, has shown a more consistent growth trajectory. From 2014 to 2024, Corning's revenue surged by about 35%, reflecting its strategic innovations and market adaptability. This comparison not only highlights the resilience and adaptability of these corporations but also underscores the dynamic nature of the global market.
Explore the chart to delve deeper into the financial narratives of these industry leaders.
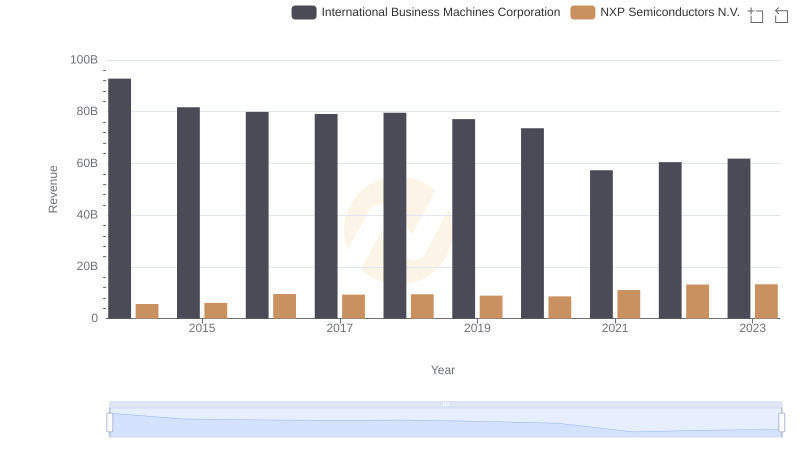
Comparing Revenue Performance: International Business Machines Corporation or NXP Semiconductors N.V.?
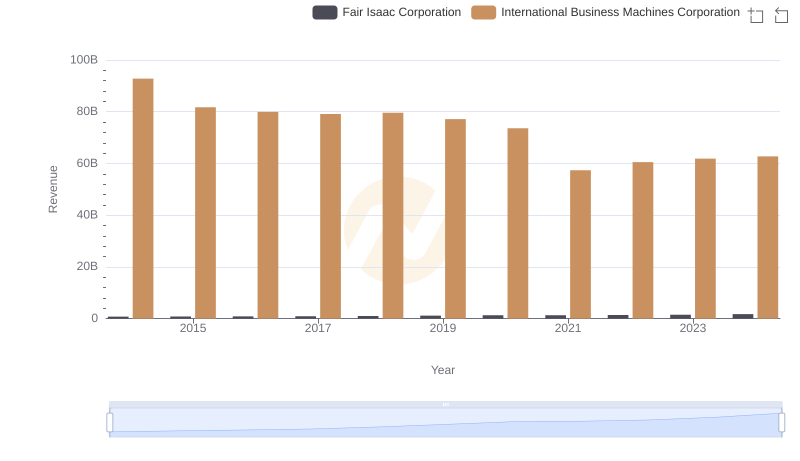
Revenue Showdown: International Business Machines Corporation vs Fair Isaac Corporation
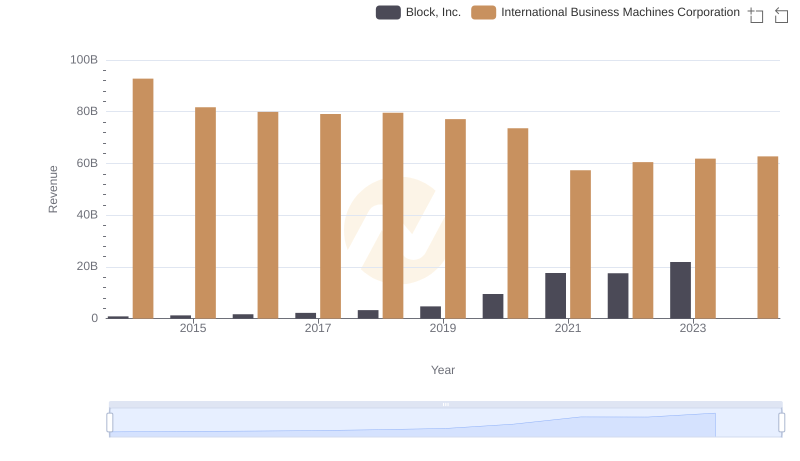
Who Generates More Revenue? International Business Machines Corporation or Block, Inc.
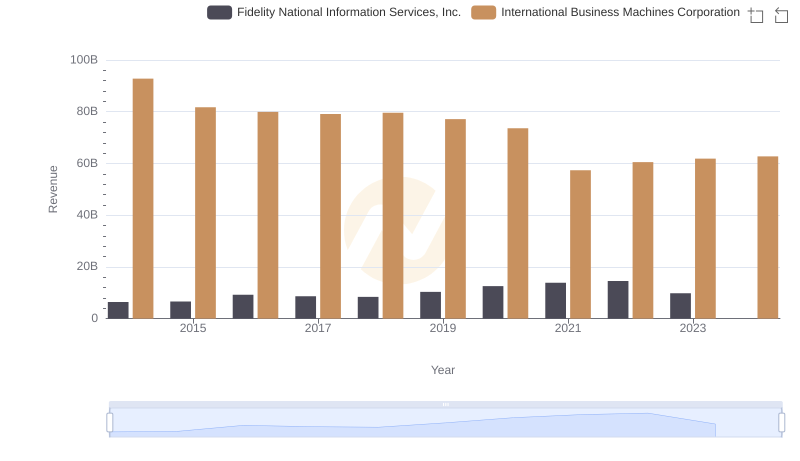
International Business Machines Corporation and Fidelity National Information Services, Inc.: A Comprehensive Revenue Analysis
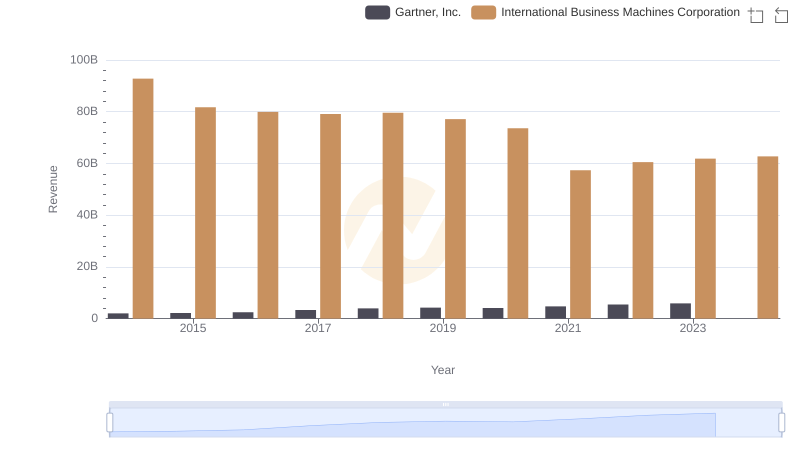
International Business Machines Corporation vs Gartner, Inc.: Examining Key Revenue Metrics
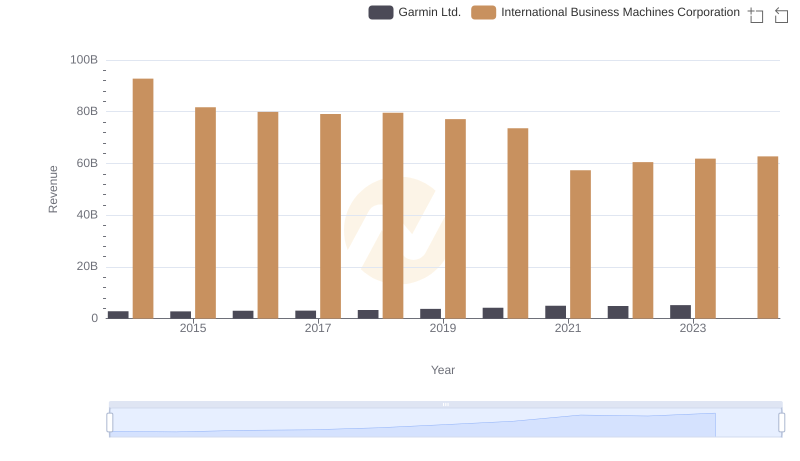
International Business Machines Corporation vs Garmin Ltd.: Examining Key Revenue Metrics
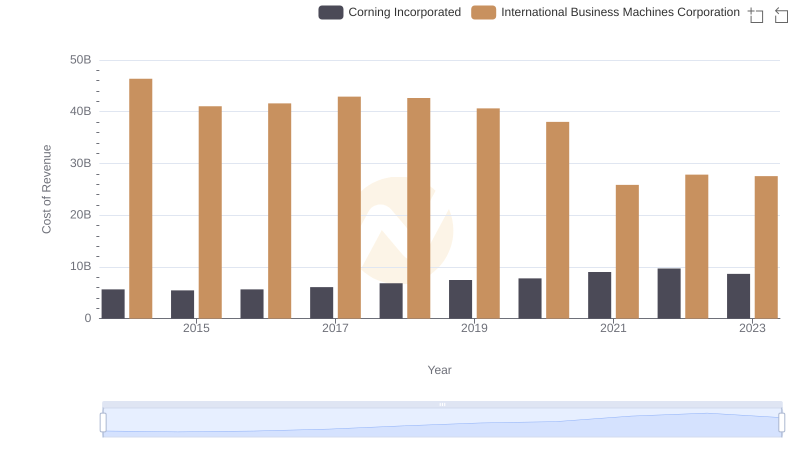
Cost of Revenue: Key Insights for International Business Machines Corporation and Corning Incorporated
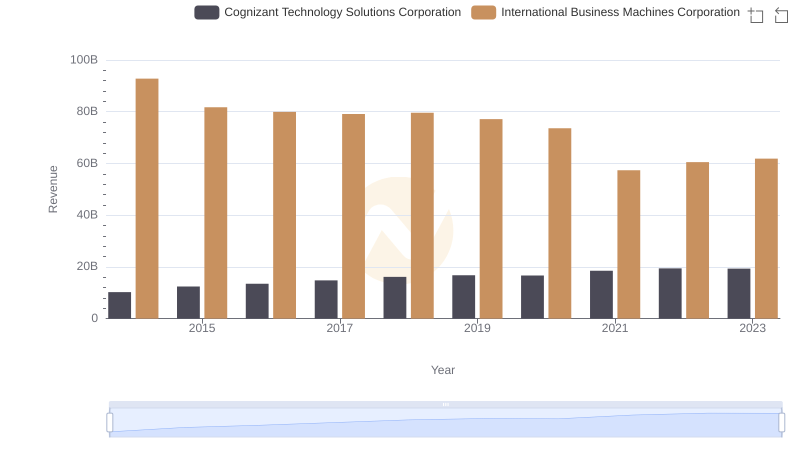
Breaking Down Revenue Trends: International Business Machines Corporation vs Cognizant Technology Solutions Corporation
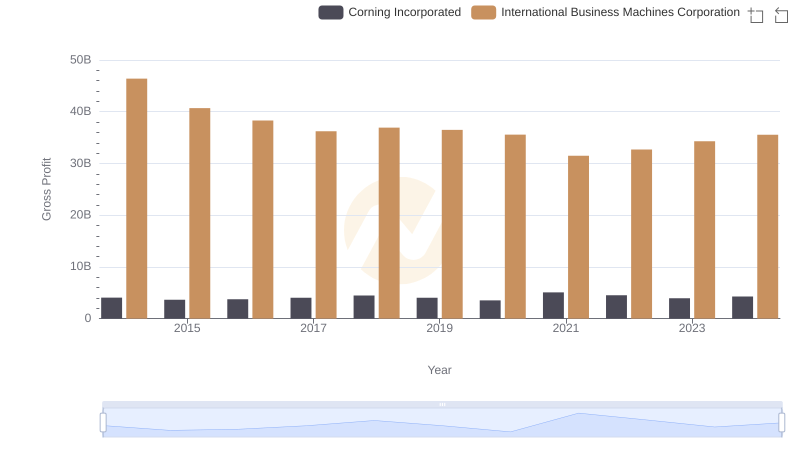
Key Insights on Gross Profit: International Business Machines Corporation vs Corning Incorporated
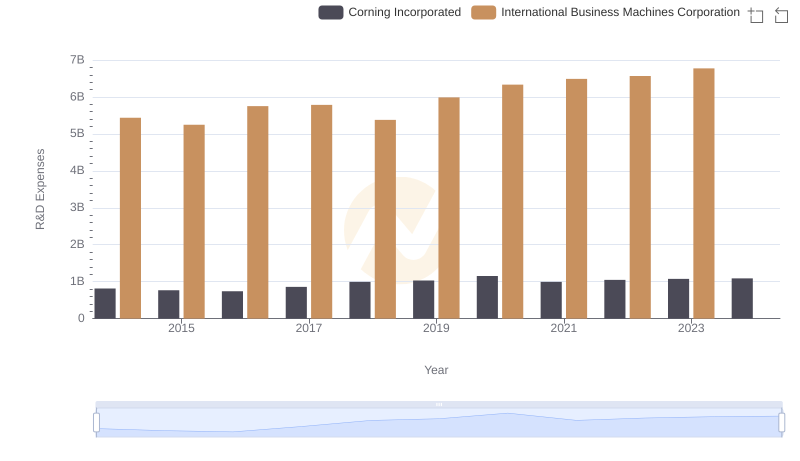
Research and Development: Comparing Key Metrics for International Business Machines Corporation and Corning Incorporated
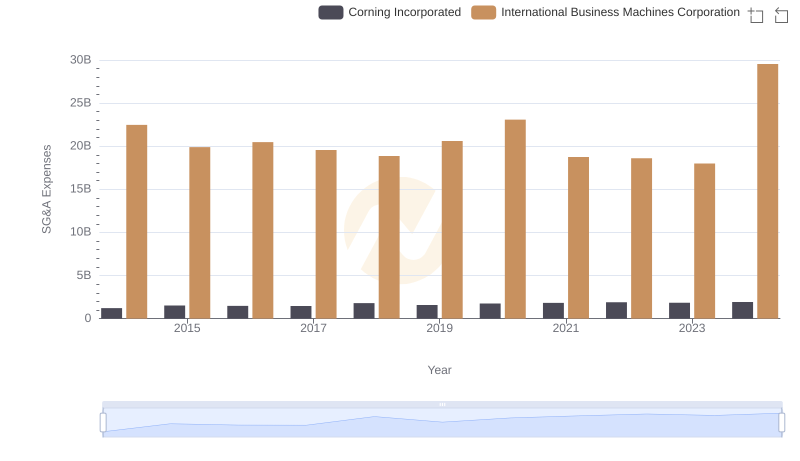
Selling, General, and Administrative Costs: International Business Machines Corporation vs Corning Incorporated
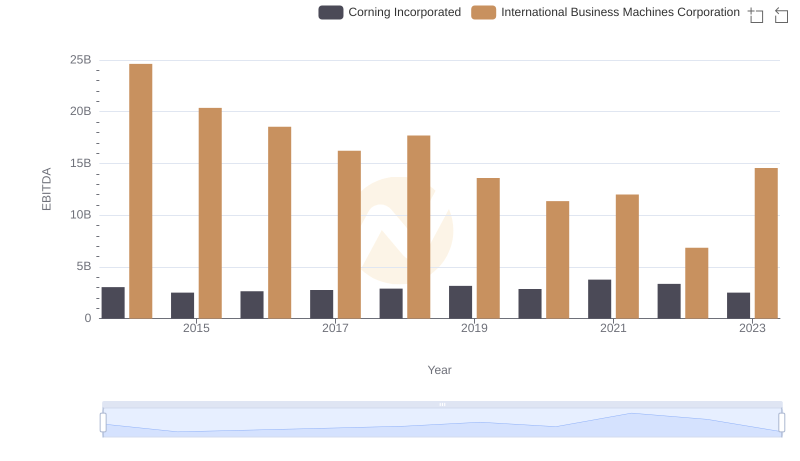
Comprehensive EBITDA Comparison: International Business Machines Corporation vs Corning Incorporated