| __timestamp | Automatic Data Processing, Inc. | Cintas Corporation |
|---|---|---|
| Wednesday, January 1, 2014 | 4611400000 | 1914386000 |
| Thursday, January 1, 2015 | 4133200000 | 1921337000 |
| Friday, January 1, 2016 | 4450200000 | 2129870000 |
| Sunday, January 1, 2017 | 4712600000 | 2380295000 |
| Monday, January 1, 2018 | 5016700000 | 2908523000 |
| Tuesday, January 1, 2019 | 5526700000 | 3128588000 |
| Wednesday, January 1, 2020 | 6144700000 | 3233748000 |
| Friday, January 1, 2021 | 6365100000 | 3314651000 |
| Saturday, January 1, 2022 | 7036400000 | 3632246000 |
| Sunday, January 1, 2023 | 8058800000 | 4173368000 |
| Monday, January 1, 2024 | 8725900000 | 4686416000 |
Unveiling the hidden dimensions of data
In the ever-evolving landscape of corporate finance, the gross profit trends of Automatic Data Processing, Inc. (ADP) and Cintas Corporation offer a fascinating glimpse into their financial trajectories over the past decade. From 2014 to 2024, ADP's gross profit surged by approximately 89%, reflecting its robust business model and strategic growth initiatives. In contrast, Cintas Corporation, a leader in corporate uniform supply, experienced a commendable 145% increase in gross profit, showcasing its resilience and adaptability in a competitive market.
These trends not only reflect the companies' financial health but also their ability to navigate economic challenges and capitalize on market opportunities.
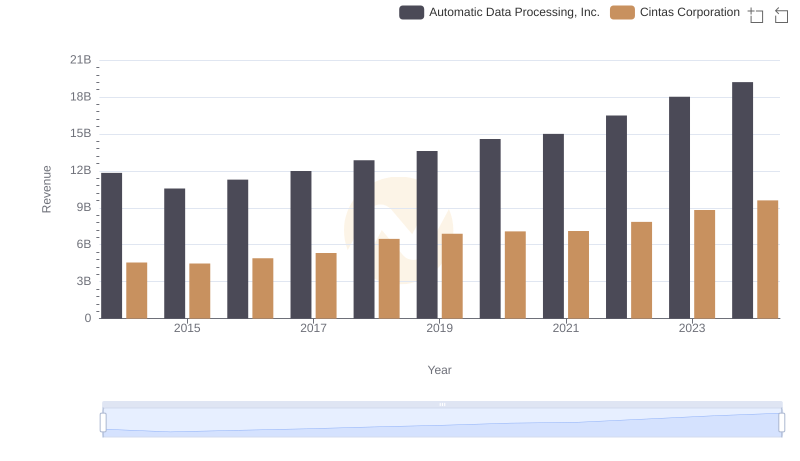
Automatic Data Processing, Inc. or Cintas Corporation: Who Leads in Yearly Revenue?
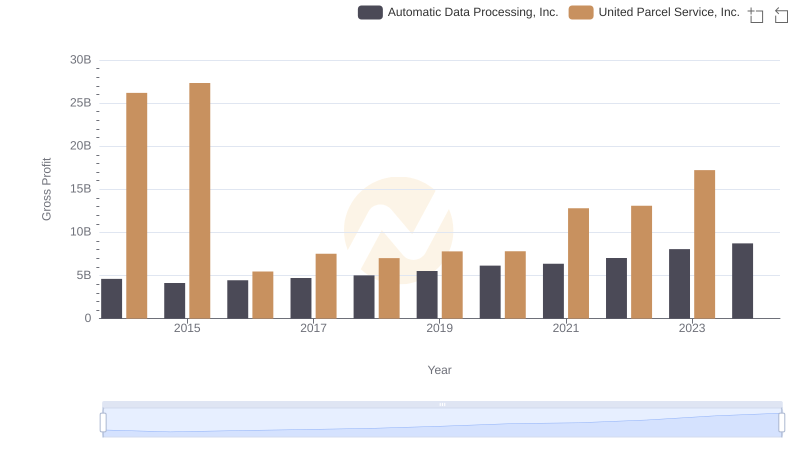
Who Generates Higher Gross Profit? Automatic Data Processing, Inc. or United Parcel Service, Inc.
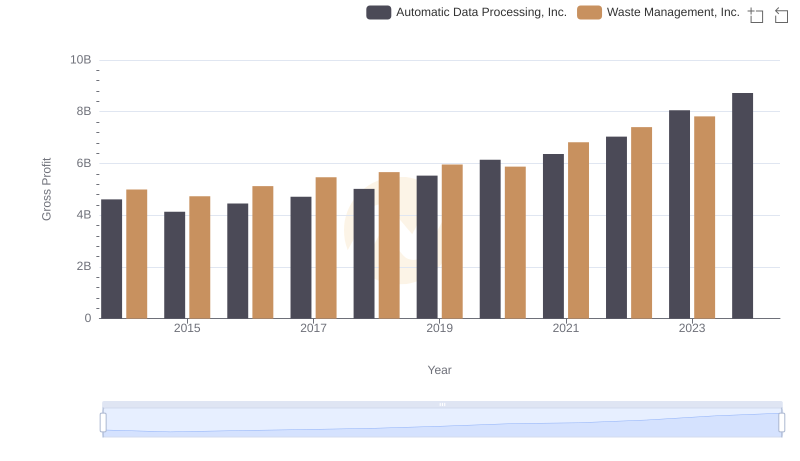
Automatic Data Processing, Inc. vs Waste Management, Inc.: A Gross Profit Performance Breakdown
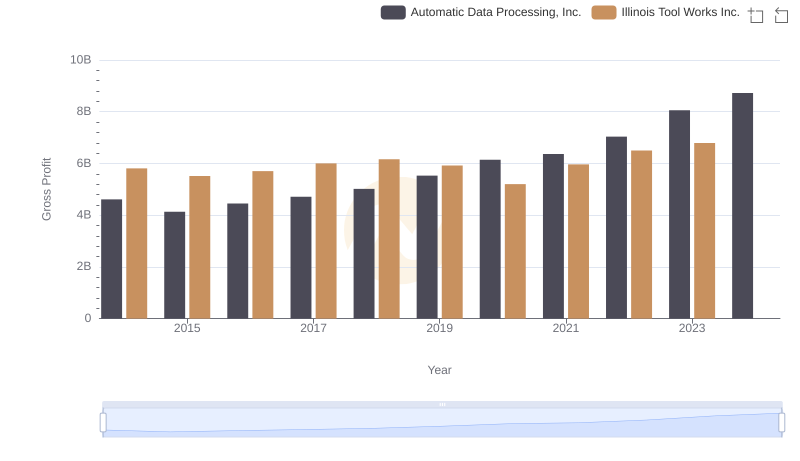
Gross Profit Trends Compared: Automatic Data Processing, Inc. vs Illinois Tool Works Inc.

Gross Profit Analysis: Comparing Automatic Data Processing, Inc. and Thomson Reuters Corporation
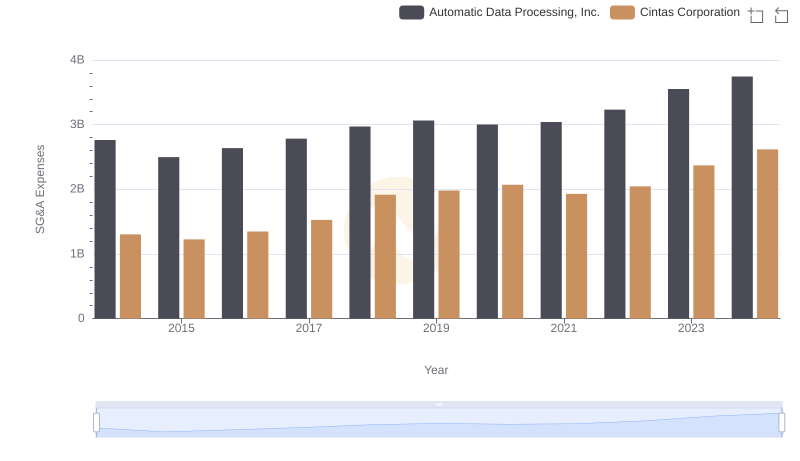
SG&A Efficiency Analysis: Comparing Automatic Data Processing, Inc. and Cintas Corporation