| __timestamp | Block, Inc. | Zebra Technologies Corporation |
|---|---|---|
| Wednesday, January 1, 2014 | 624118000 | 892547000 |
| Thursday, January 1, 2015 | 897088000 | 2007739000 |
| Friday, January 1, 2016 | 1132683000 | 1932000000 |
| Sunday, January 1, 2017 | 1374947000 | 2012000000 |
| Monday, January 1, 2018 | 1994477000 | 2237000000 |
| Tuesday, January 1, 2019 | 2823815000 | 2385000000 |
| Wednesday, January 1, 2020 | 6764169000 | 2445000000 |
| Friday, January 1, 2021 | 13241380000 | 2999000000 |
| Saturday, January 1, 2022 | 11539695000 | 3157000000 |
| Sunday, January 1, 2023 | 14410737000 | 2461000000 |
| Monday, January 1, 2024 | 2568000000 |
Data in motion
In the ever-evolving landscape of technology, understanding the cost of revenue is crucial for assessing a company's financial health. Block, Inc. and Zebra Technologies Corporation, two giants in their respective fields, offer a fascinating comparison. From 2014 to 2023, Block, Inc. saw a staggering increase in its cost of revenue, growing by over 2,200%, from approximately $624 million to $14.4 billion. This reflects Block's aggressive expansion and scaling strategies. In contrast, Zebra Technologies Corporation experienced a more modest growth of around 176%, from $892 million to $2.46 billion, indicating steady and sustainable growth.
Block, Inc.'s rapid increase in cost of revenue highlights its dynamic approach to capturing market share, while Zebra Technologies' consistent growth underscores its focus on stability and efficiency. This comparison provides valuable insights into how different strategies impact financial outcomes over time.
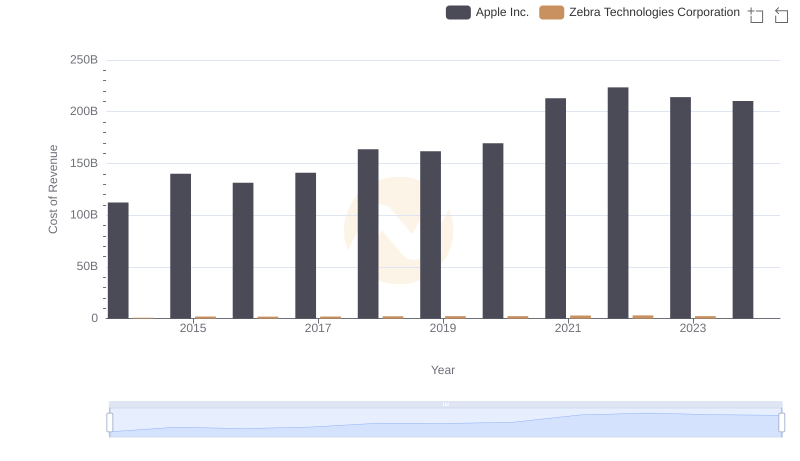
Apple Inc. vs Zebra Technologies Corporation: Efficiency in Cost of Revenue Explored
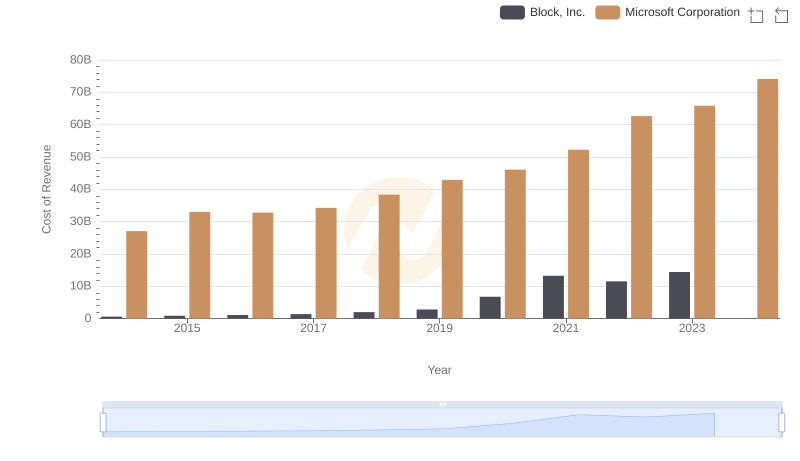
Cost of Revenue Trends: Microsoft Corporation vs Block, Inc.
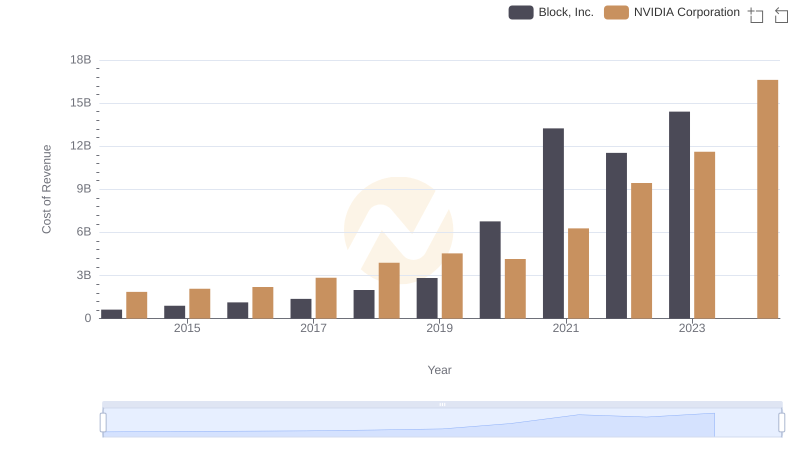
Cost of Revenue Comparison: NVIDIA Corporation vs Block, Inc.
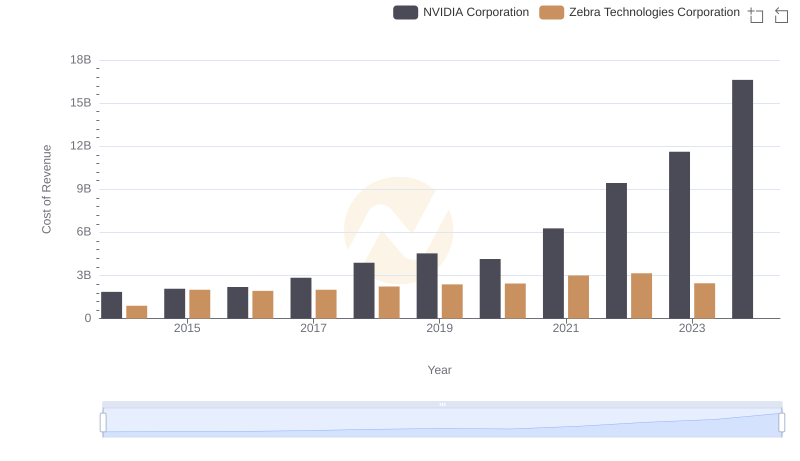
Cost of Revenue: Key Insights for NVIDIA Corporation and Zebra Technologies Corporation
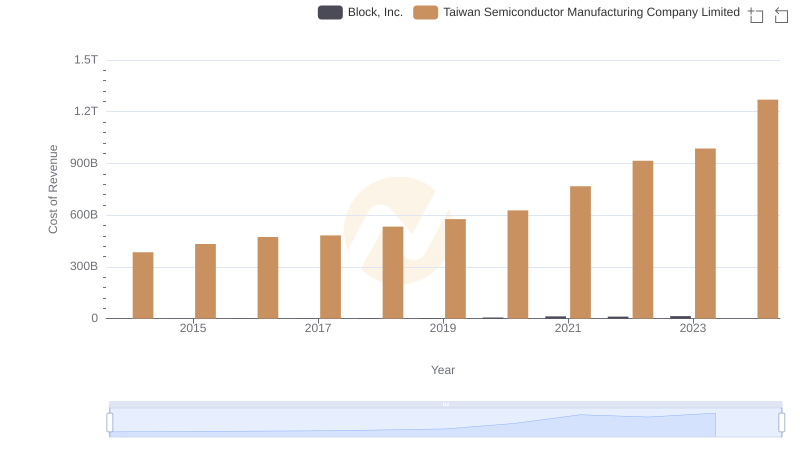
Comparing Cost of Revenue Efficiency: Taiwan Semiconductor Manufacturing Company Limited vs Block, Inc.
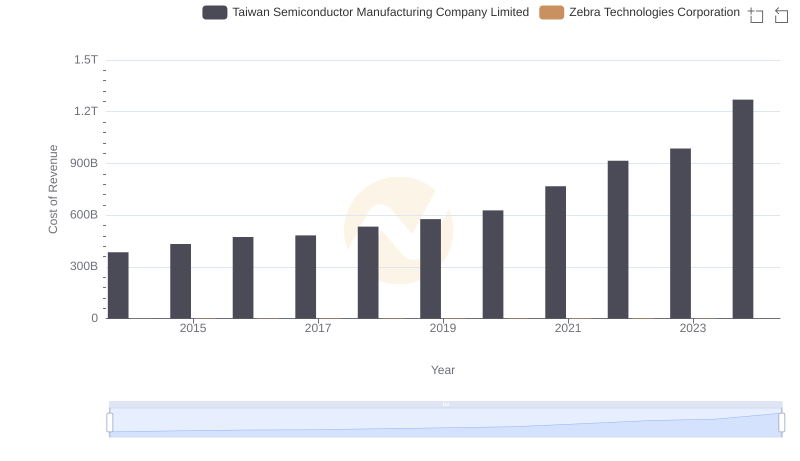
Cost of Revenue: Key Insights for Taiwan Semiconductor Manufacturing Company Limited and Zebra Technologies Corporation
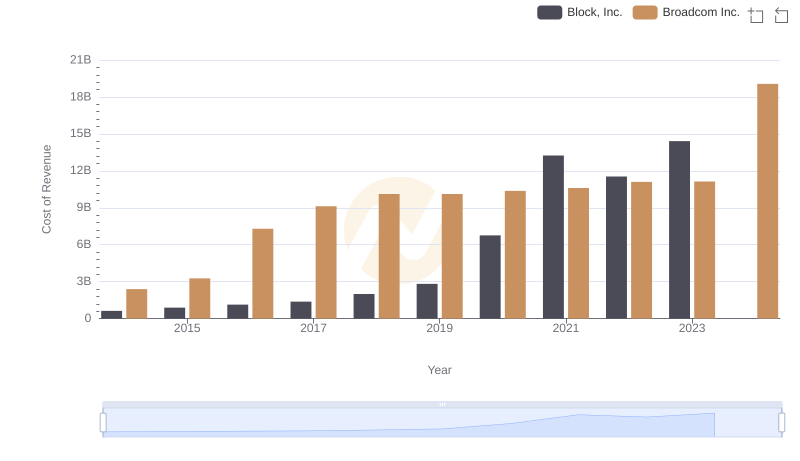
Comparing Cost of Revenue Efficiency: Broadcom Inc. vs Block, Inc.
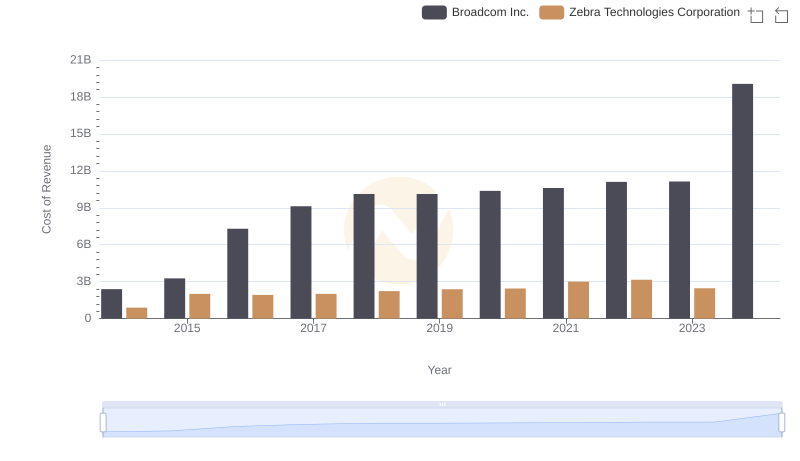
Broadcom Inc. vs Zebra Technologies Corporation: Efficiency in Cost of Revenue Explored
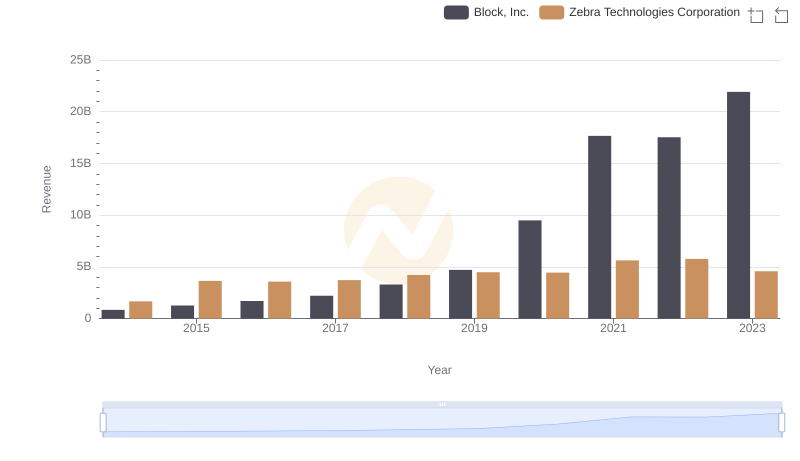
Revenue Showdown: Block, Inc. vs Zebra Technologies Corporation
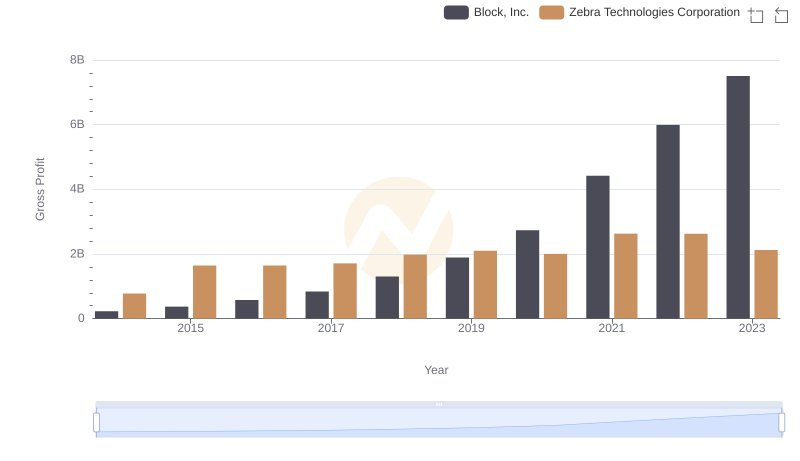
Who Generates Higher Gross Profit? Block, Inc. or Zebra Technologies Corporation
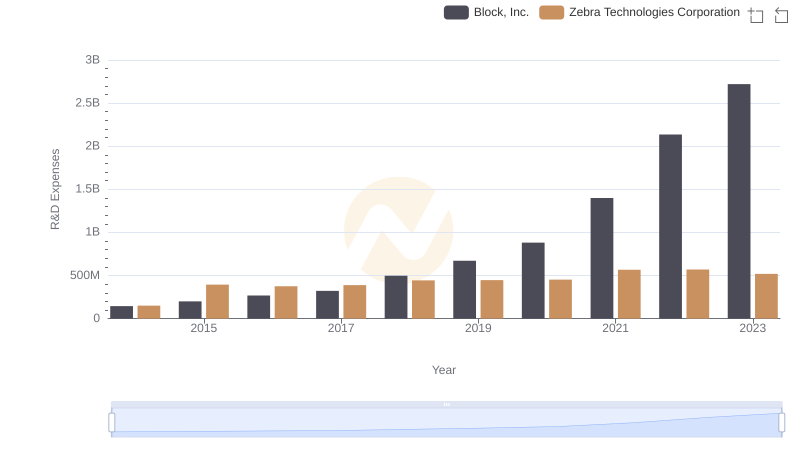
Comparing Innovation Spending: Block, Inc. and Zebra Technologies Corporation
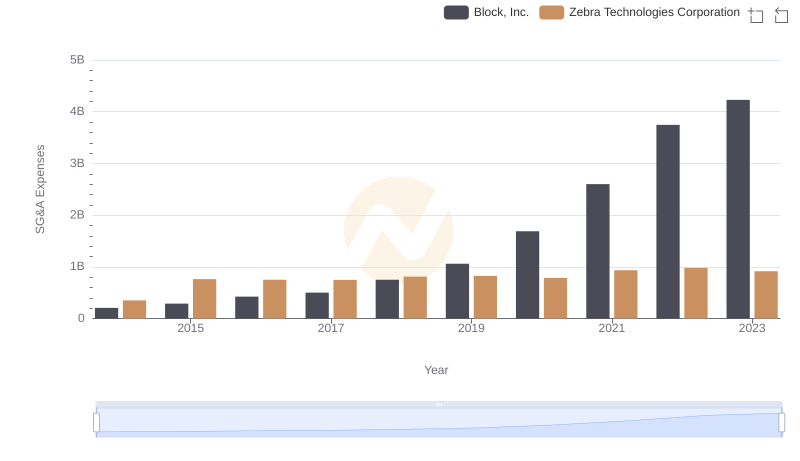
Block, Inc. or Zebra Technologies Corporation: Who Manages SG&A Costs Better?