| __timestamp | Automatic Data Processing, Inc. | Emerson Electric Co. |
|---|---|---|
| Wednesday, January 1, 2014 | 4611400000 | 10158000000 |
| Thursday, January 1, 2015 | 4133200000 | 9048000000 |
| Friday, January 1, 2016 | 4450200000 | 6262000000 |
| Sunday, January 1, 2017 | 4712600000 | 6404000000 |
| Monday, January 1, 2018 | 5016700000 | 7460000000 |
| Tuesday, January 1, 2019 | 5526700000 | 7815000000 |
| Wednesday, January 1, 2020 | 6144700000 | 7009000000 |
| Friday, January 1, 2021 | 6365100000 | 7563000000 |
| Saturday, January 1, 2022 | 7036400000 | 8188000000 |
| Sunday, January 1, 2023 | 8058800000 | 7427000000 |
| Monday, January 1, 2024 | 8725900000 | 7808000000 |
In pursuit of knowledge
In the competitive landscape of industrial and business services, Automatic Data Processing, Inc. (ADP) and Emerson Electric Co. have showcased intriguing financial trajectories over the past decade. From 2014 to 2024, ADP's gross profit surged by approximately 89%, reflecting a robust growth strategy and market adaptability. In contrast, Emerson Electric Co. experienced a more modest increase of about 23%, highlighting different market dynamics and operational challenges.
ADP's gross profit consistently climbed, peaking in 2024, while Emerson's performance fluctuated, with a notable dip in 2016. This divergence underscores the varying impacts of economic cycles and strategic decisions on these industry leaders. As we look to the future, understanding these trends offers valuable insights into the evolving business landscape and the factors driving financial success.
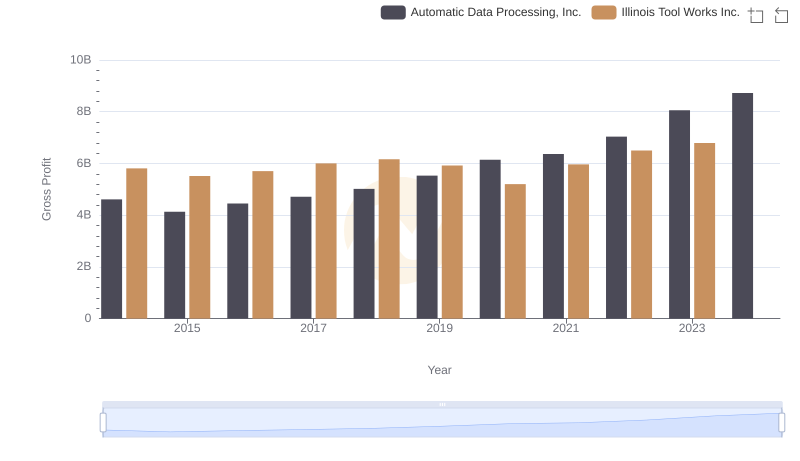
Gross Profit Trends Compared: Automatic Data Processing, Inc. vs Illinois Tool Works Inc.

Gross Profit Analysis: Comparing Automatic Data Processing, Inc. and Thomson Reuters Corporation

Automatic Data Processing, Inc. vs FedEx Corporation: A Gross Profit Performance Breakdown
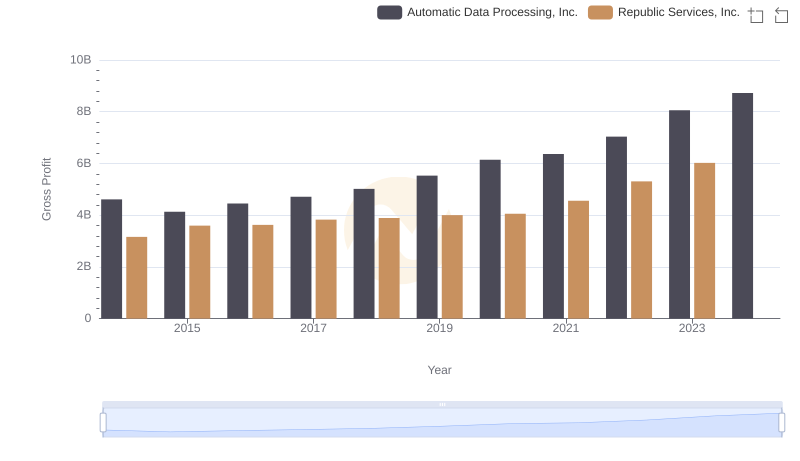
Gross Profit Comparison: Automatic Data Processing, Inc. and Republic Services, Inc. Trends
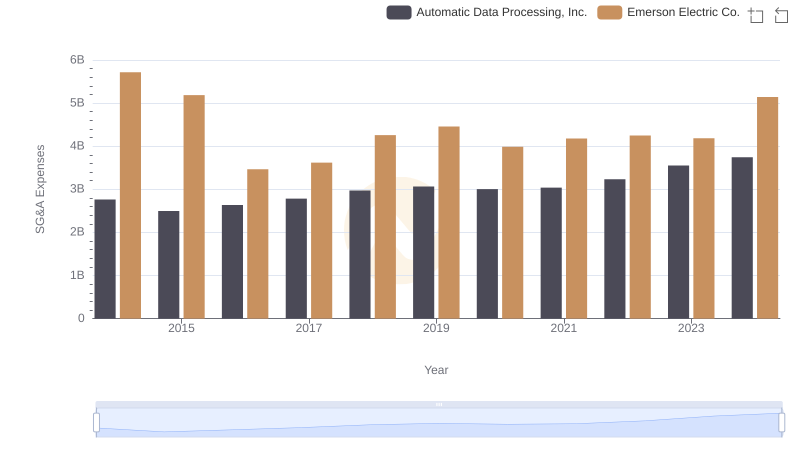
Comparing SG&A Expenses: Automatic Data Processing, Inc. vs Emerson Electric Co. Trends and Insights