| __timestamp | 3M Company | Automatic Data Processing, Inc. |
|---|---|---|
| Wednesday, January 1, 2014 | 31821000000 | 11832800000 |
| Thursday, January 1, 2015 | 30274000000 | 10560800000 |
| Friday, January 1, 2016 | 30109000000 | 11290500000 |
| Sunday, January 1, 2017 | 31657000000 | 11982400000 |
| Monday, January 1, 2018 | 32765000000 | 12859300000 |
| Tuesday, January 1, 2019 | 32136000000 | 13613300000 |
| Wednesday, January 1, 2020 | 32184000000 | 14589800000 |
| Friday, January 1, 2021 | 35355000000 | 15005400000 |
| Saturday, January 1, 2022 | 34229000000 | 16498300000 |
| Sunday, January 1, 2023 | 32681000000 | 18012200000 |
| Monday, January 1, 2024 | 24575000000 | 19202600000 |
Unlocking the unknown
In the ever-evolving landscape of American business, Automatic Data Processing, Inc. (ADP) and 3M Company stand as titans in their respective fields. Over the past decade, from 2014 to 2024, these companies have showcased intriguing revenue trajectories.
ADP has demonstrated a robust growth pattern, with its revenue surging by approximately 62% from 2014 to 2024. This upward trend highlights ADP's strategic adaptability and market expansion. In contrast, 3M's revenue has experienced fluctuations, peaking in 2021 before a notable decline by 2024, reflecting a 23% drop from its 2021 high. This variance underscores the challenges faced by 3M in maintaining consistent growth amidst global economic shifts.
These insights into ADP and 3M's revenue trends offer a window into the broader economic forces at play, providing valuable lessons for investors and industry analysts alike.
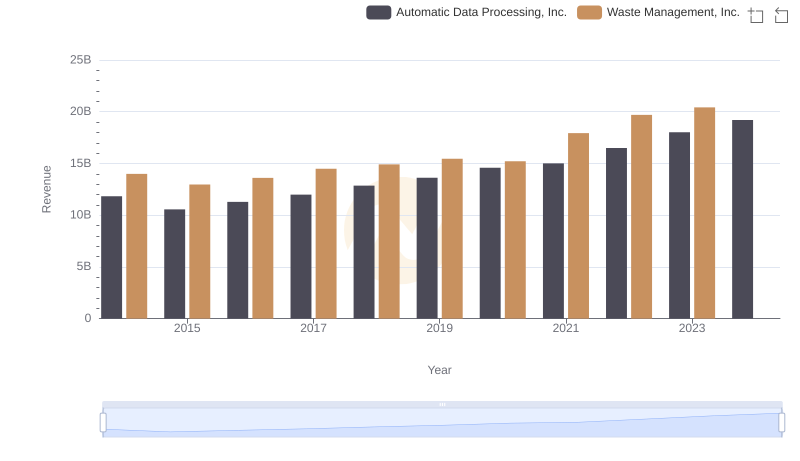
Revenue Showdown: Automatic Data Processing, Inc. vs Waste Management, Inc.
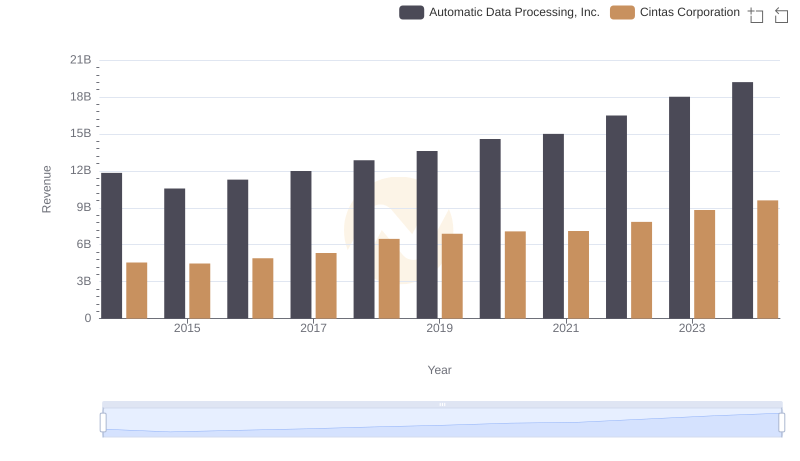
Automatic Data Processing, Inc. or Cintas Corporation: Who Leads in Yearly Revenue?
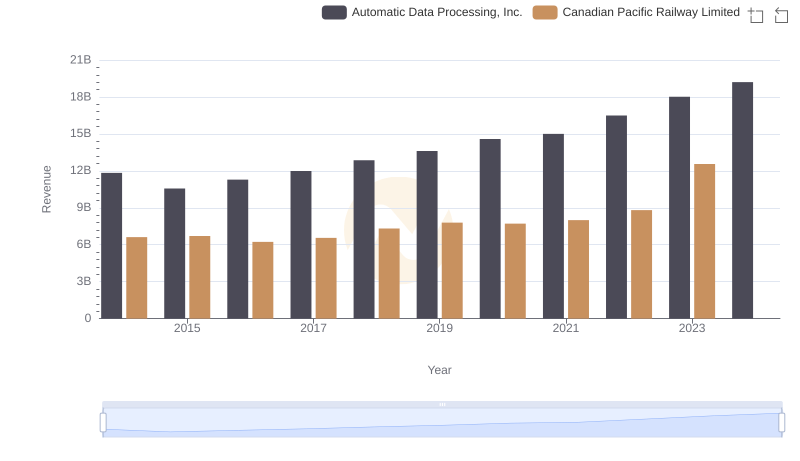
Who Generates More Revenue? Automatic Data Processing, Inc. or Canadian Pacific Railway Limited
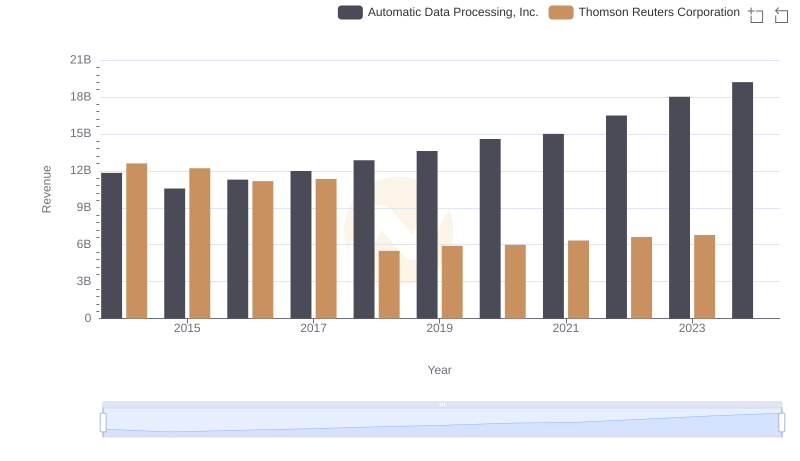
Automatic Data Processing, Inc. or Thomson Reuters Corporation: Who Leads in Yearly Revenue?
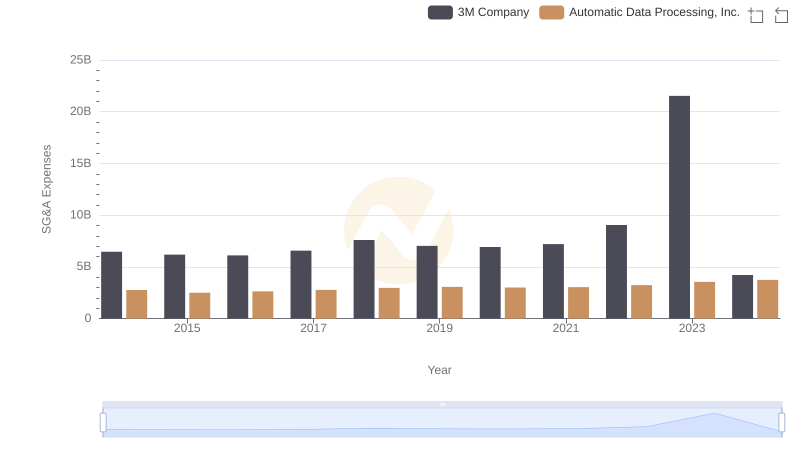
Automatic Data Processing, Inc. vs 3M Company: SG&A Expense Trends